MATLAB fimplicit in MATLAB®
Learn how to make 4 fimplicit charts in MATLAB, then publish them to the Web with Plotly.
Plot Implicit Function
Plot the hyperbola described by the function x2-y2-1=0 over the default interval of [-5 5] for x and y.
fimplicit(@(x,y) x.^2 - y.^2 - 1)

fig2plotly()

Specify Plotting Interval
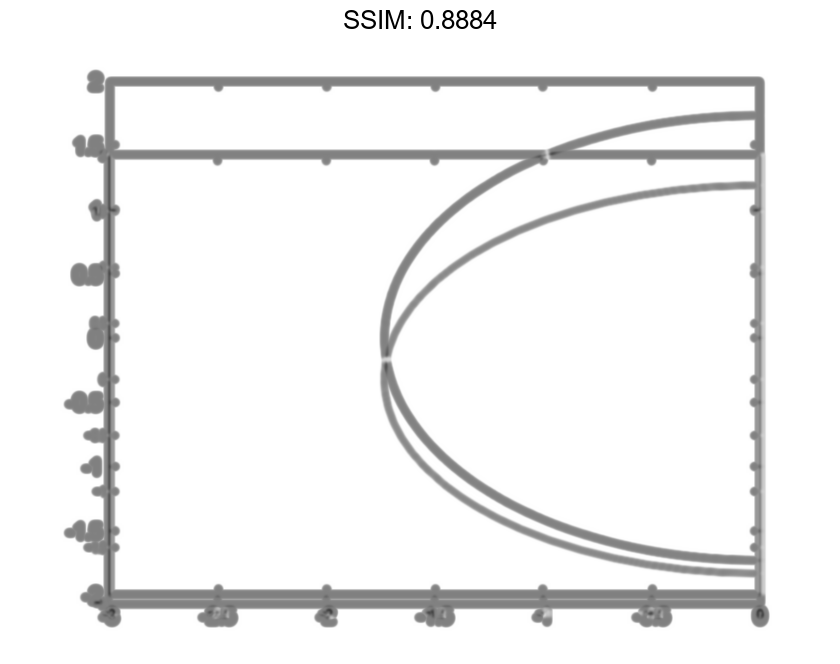
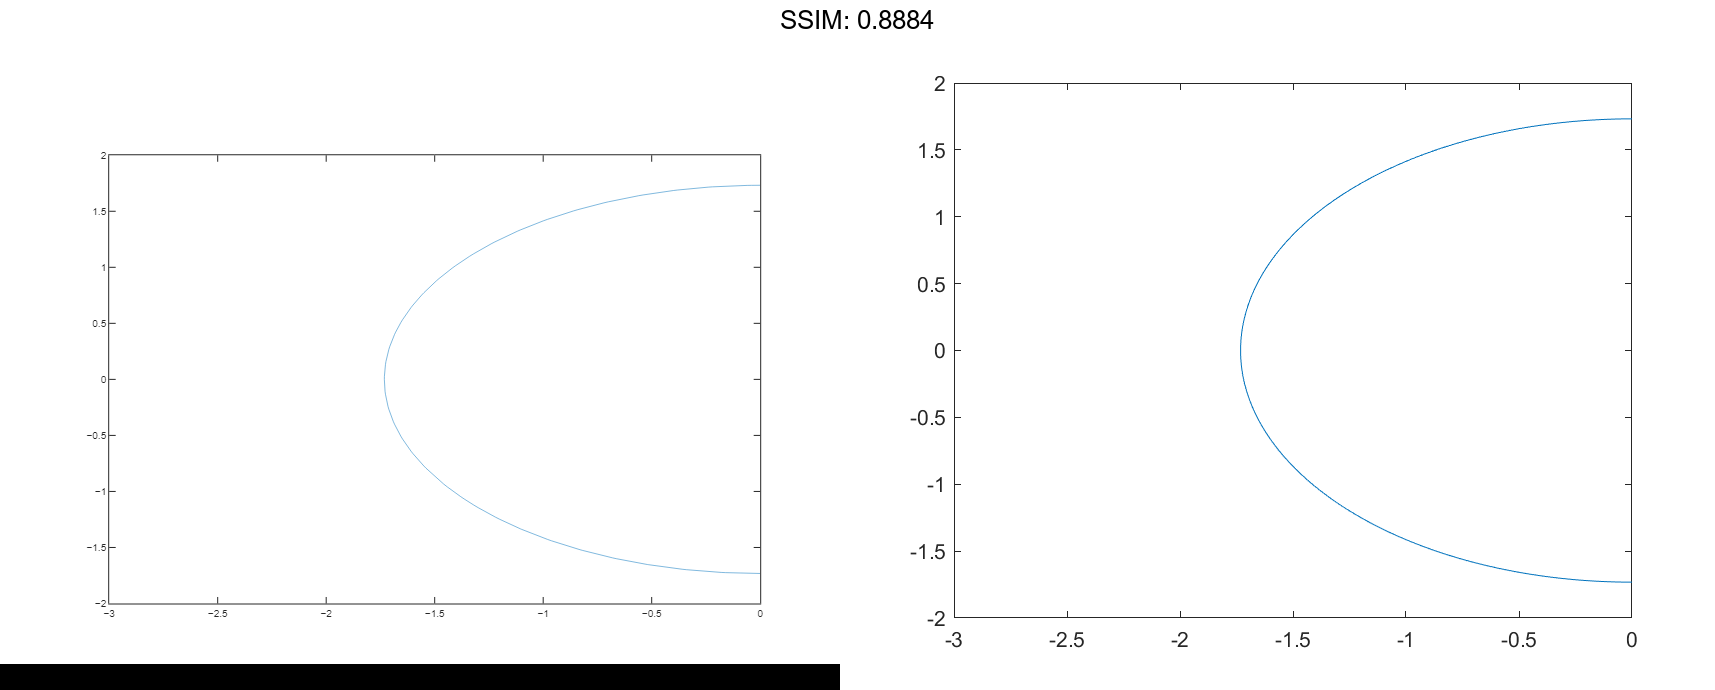
Plot the function x2+y2-3=0 over the intervals [-3 0] for x and [-2 2] for y.
f = @(x,y) x.^2 + y.^2 - 3;
fimplicit(f,[-3 0 -2 2])

fig2plotly()
Modify Appearance of Implicit Plot
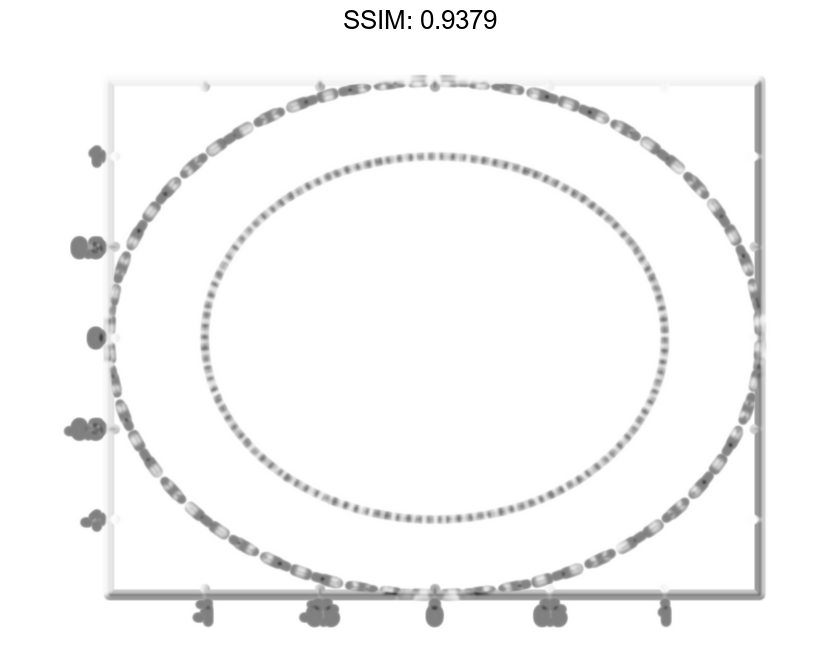
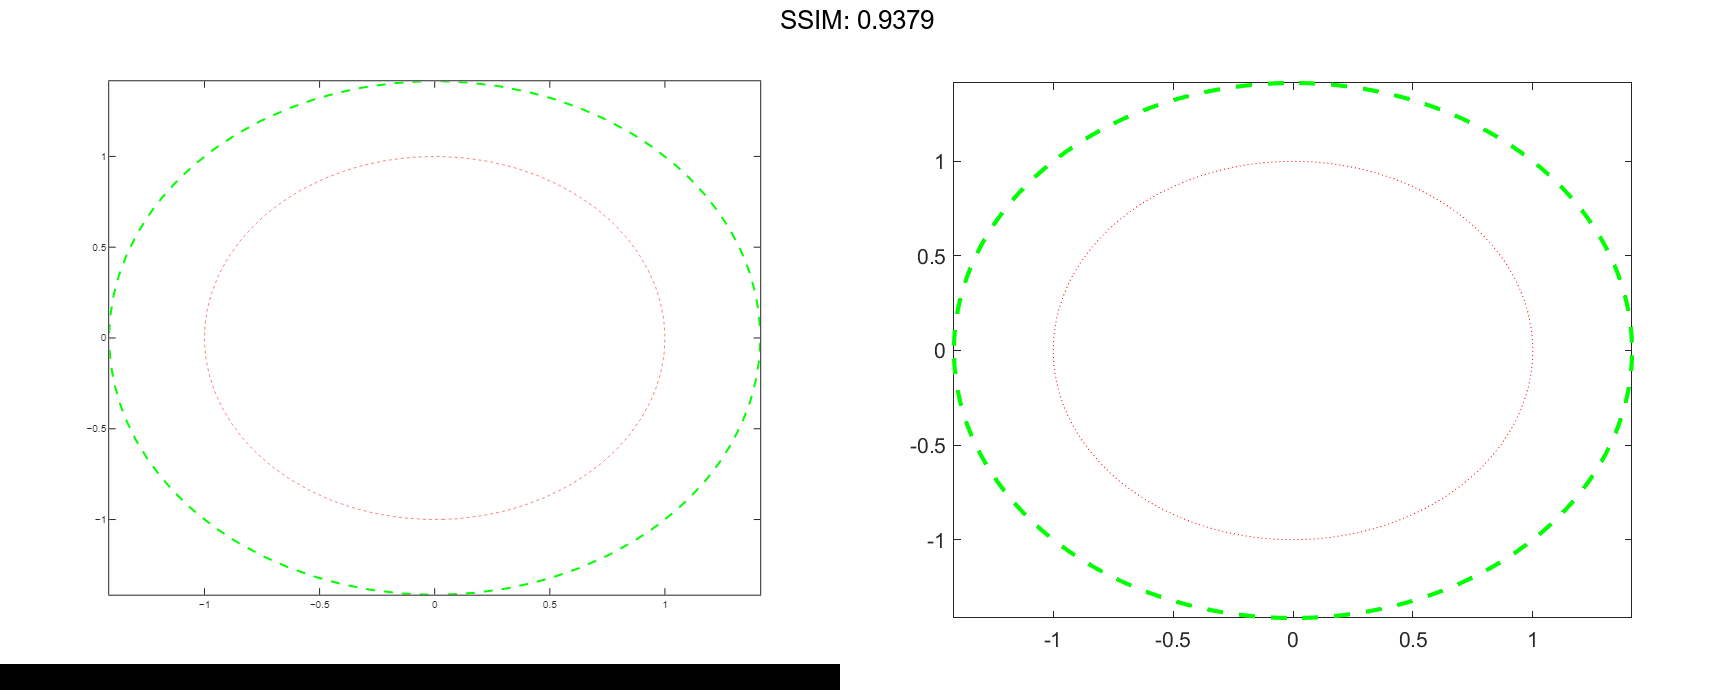
Plot two circles centered at (0,0) with different radius values. For the first circle, use a dotted, red line. For the second circle, use a dashed, green line with a line width of 2 points.
f1 = @(x,y) x.^2 + y.^2 - 1;
fimplicit(f1,':r')

hold on
f2 = @(x,y) x.^2 + y.^2 - 2;
fimplicit(f2,'--g','LineWidth',2)
hold off

fig2plotly()
Modify Implicit Plot After Creation
Plot the implicit function ysin(x)+xcos(y)-1=0 and assign the implicit function line object to the variable fp.
fp = fimplicit(@(x,y) y.sin(x) + x.cos(y) - 1)

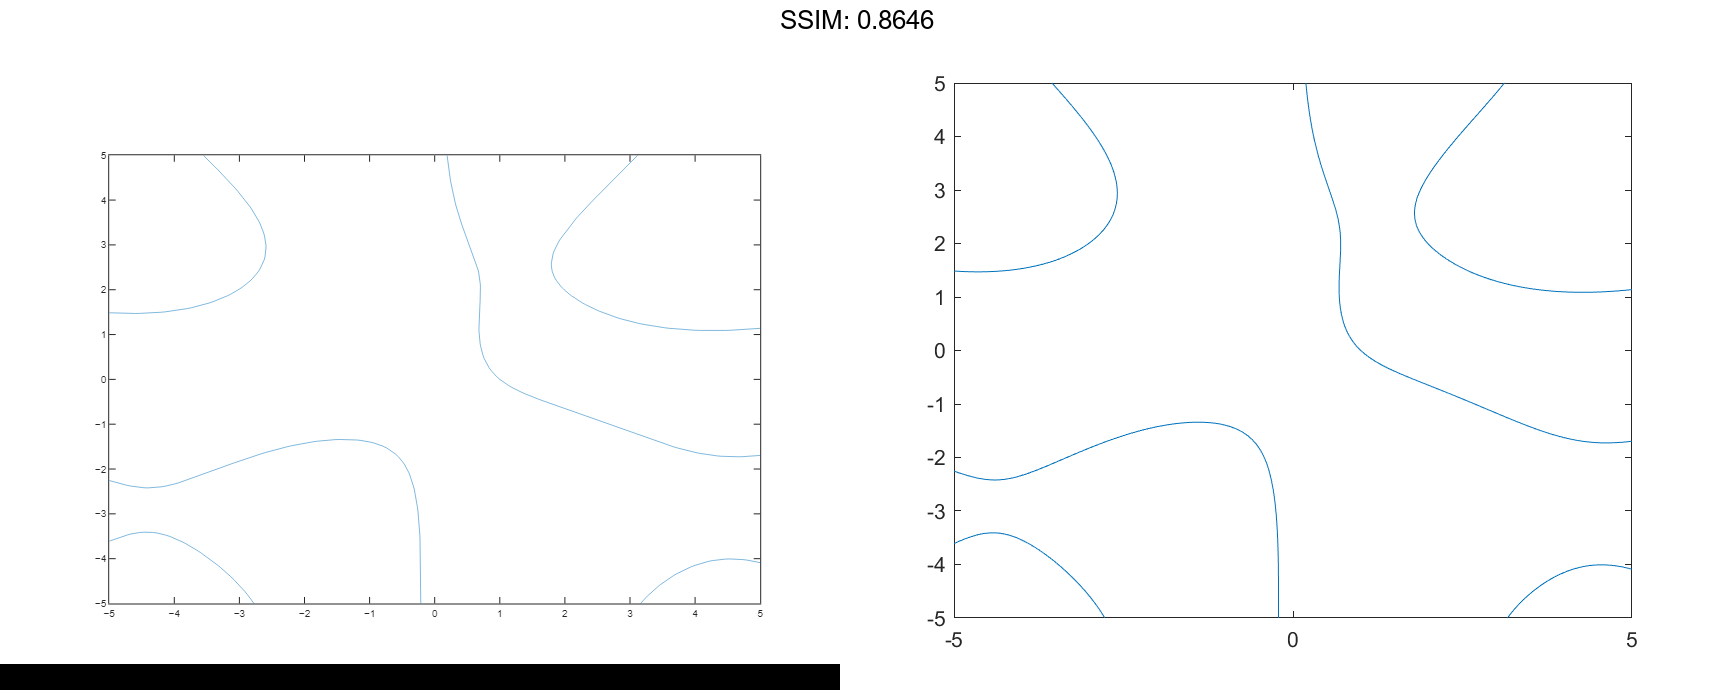
fp =
  ImplicitFunctionLine with properties:

     Function: @(x,y)y.*sin(x)+x.*cos(y)-1
        Color: [0 0.4470 0.7410]
    LineStyle: '-'
    LineWidth: 0.5000

  Show all properties
fp.Color = 'r';
fp.LineStyle = '--';
fp.LineWidth = 2;

fig2plotly()