MATLAB imagesc in MATLAB®
Learn how to make 5 imagesc charts in MATLAB, then publish them to the Web with Plotly.
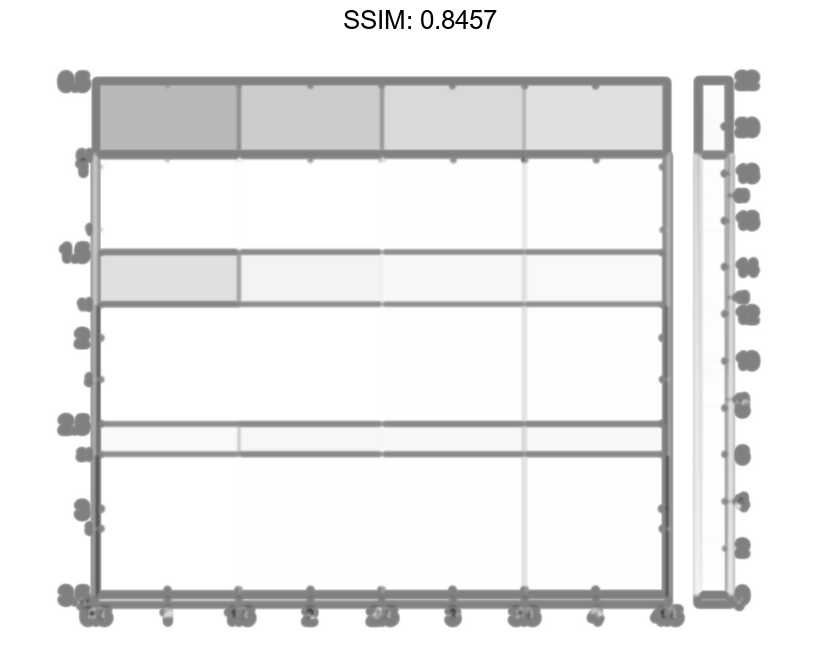
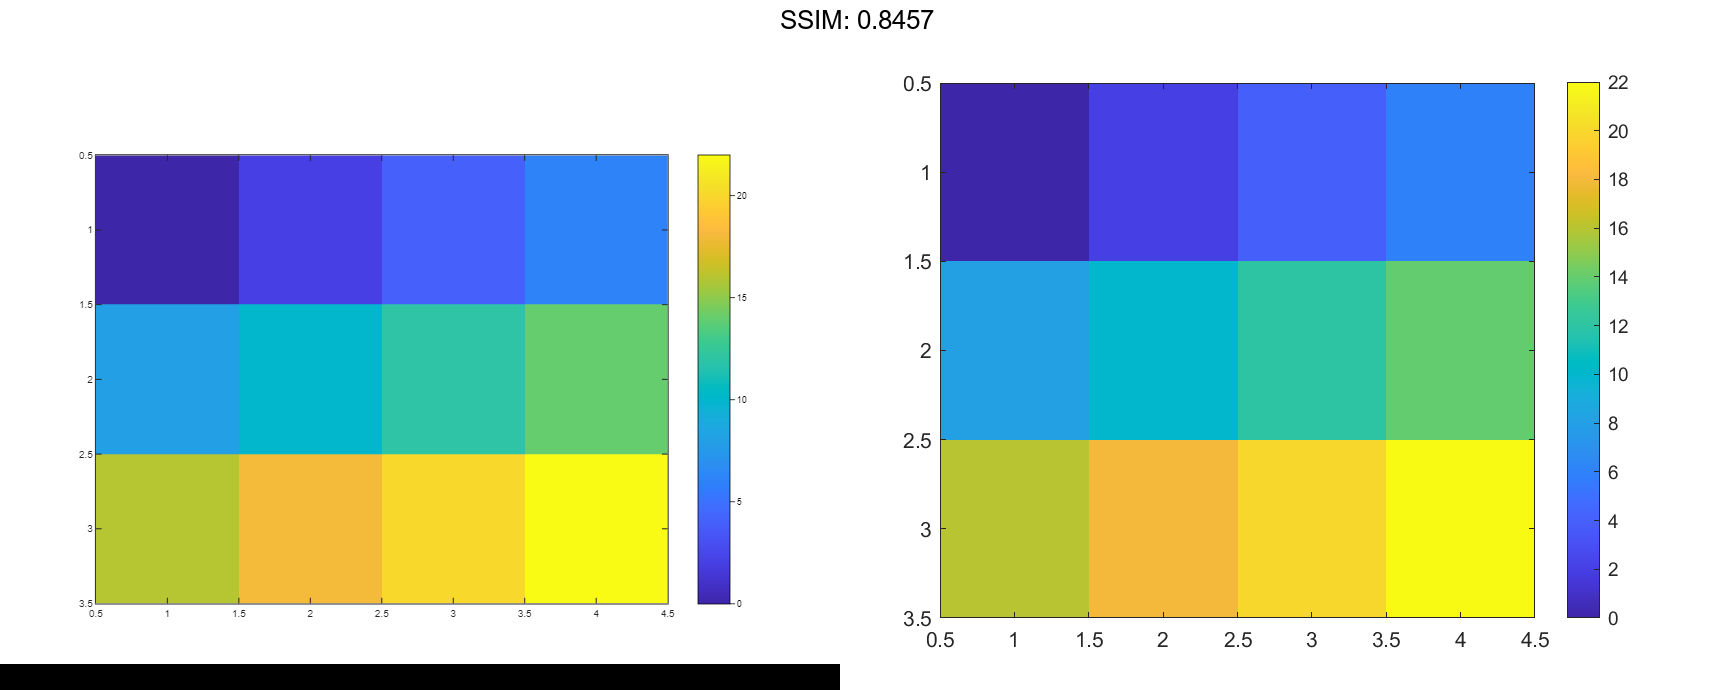
Display Image of Matrix Data
Create matrix C. Display an image of the data in C. Add a colorbar to the graph to show the current colormap. By default, imagesc scales the color limits so that image uses the full range of the colormap, where the smallest value in C maps to the first color in the colormap and the largest value maps to the last color.
C = [0 2 4 6; 8 10 12 14; 16 18 20 22];
imagesc(C)
colorbar

fig2plotly()
Control Image Placement
Place the image so that it lies between 5 and 8 on the x-axis and between 3 and 6 on the y-axis.
x = [5 8];
y = [3 6];
C = [0 2 4 6; 8 10 12 14; 16 18 20 22];
imagesc(x,y,C)

fig2plotly()
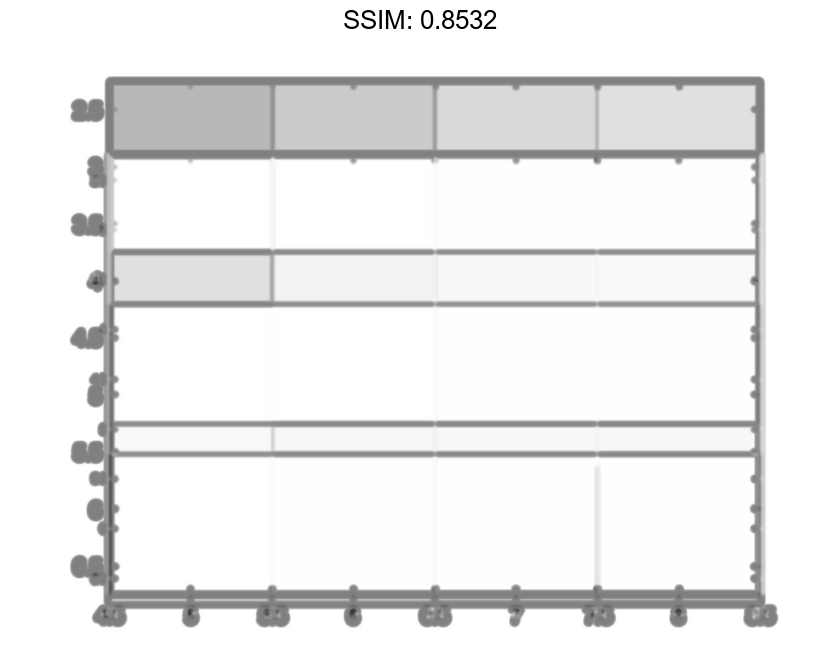
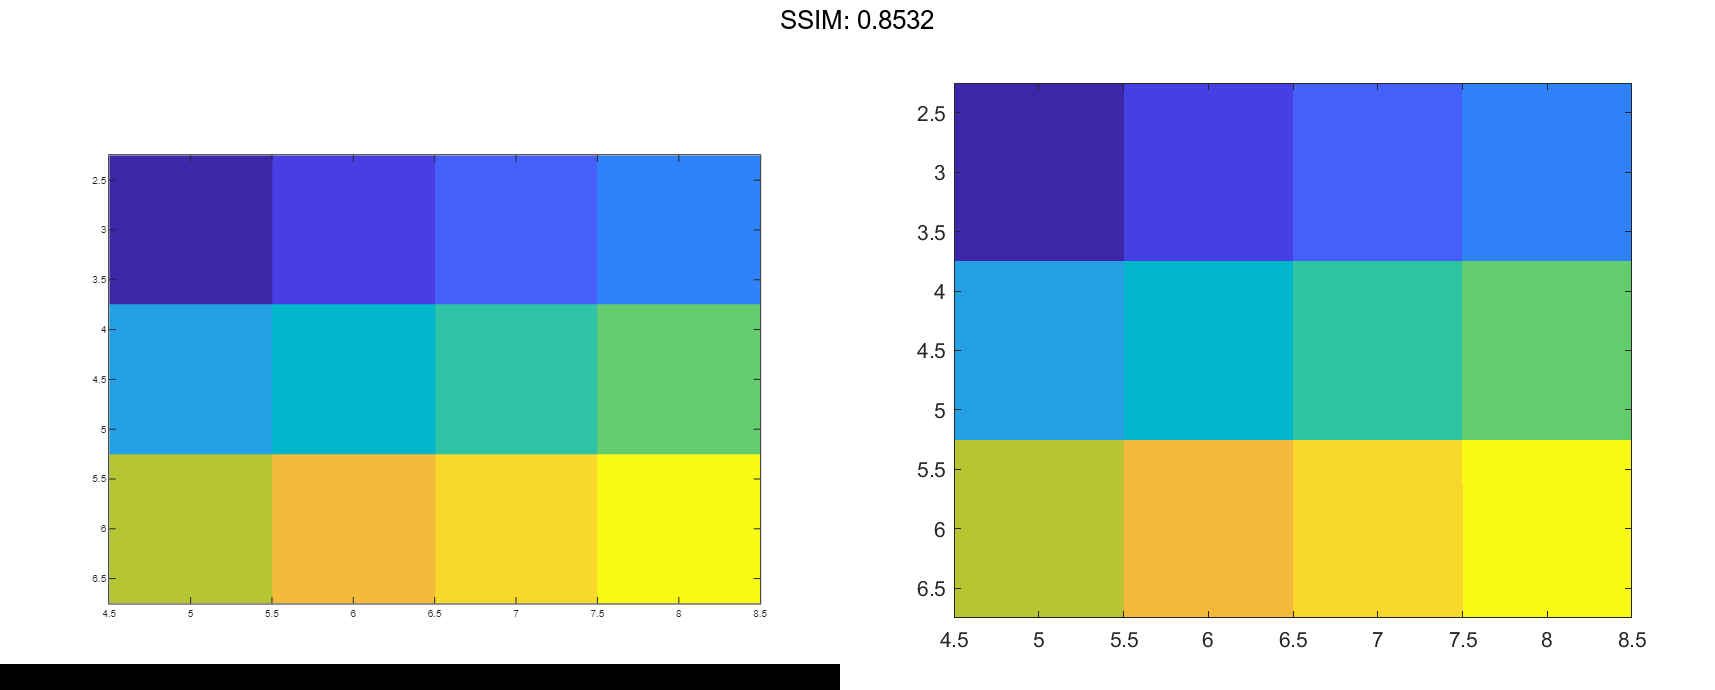
Notice that the pixel corresponding to C(1,1) is centered over the point (5,3). The pixel corresponding to C(3,4) is centered over the point (8,6). imagesc positions and orients the rest of the image between those two points.
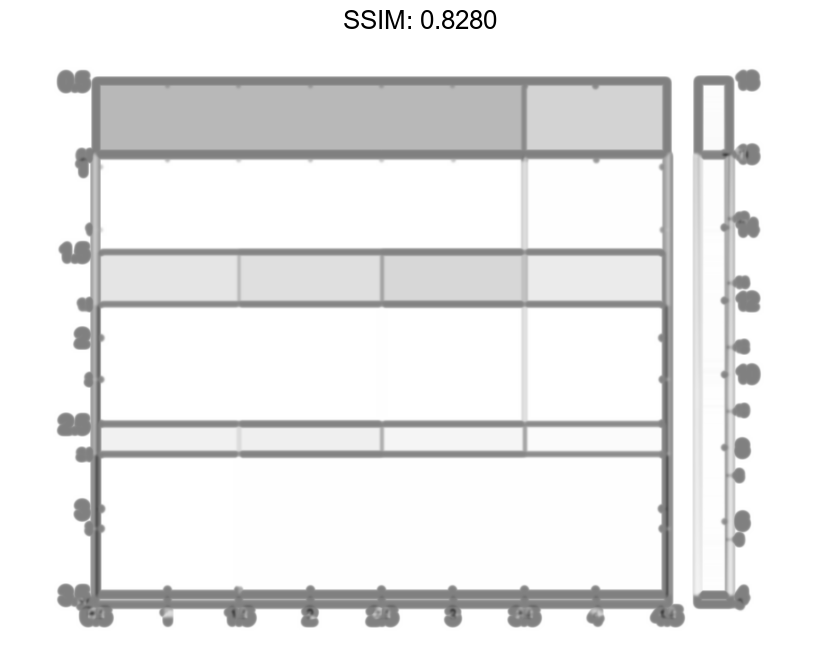
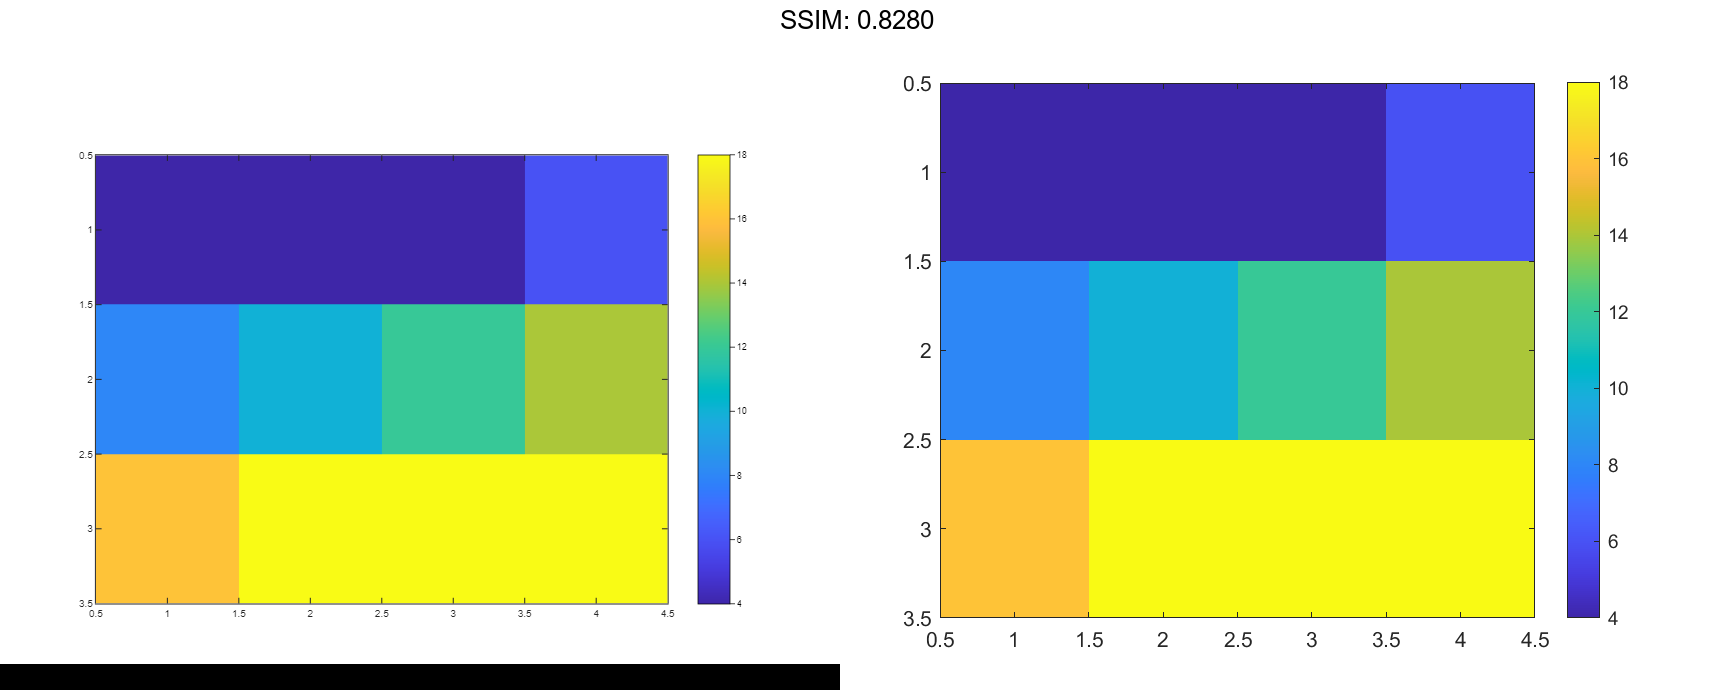
Control Scaling of Data Values into Colormap
Create C as an array of data values. Create an image of C and set the color limits so that values of 4 or less map to the first color in the colormap and values of 18 or more map to the last color in the colormap. Display a colorbar to show how the data values map into the colormap.
C = [0 2 4 6; 8 10 12 14; 16 18 20 22];
clims = [4 18];
imagesc(C,clims)
colorbar

fig2plotly()
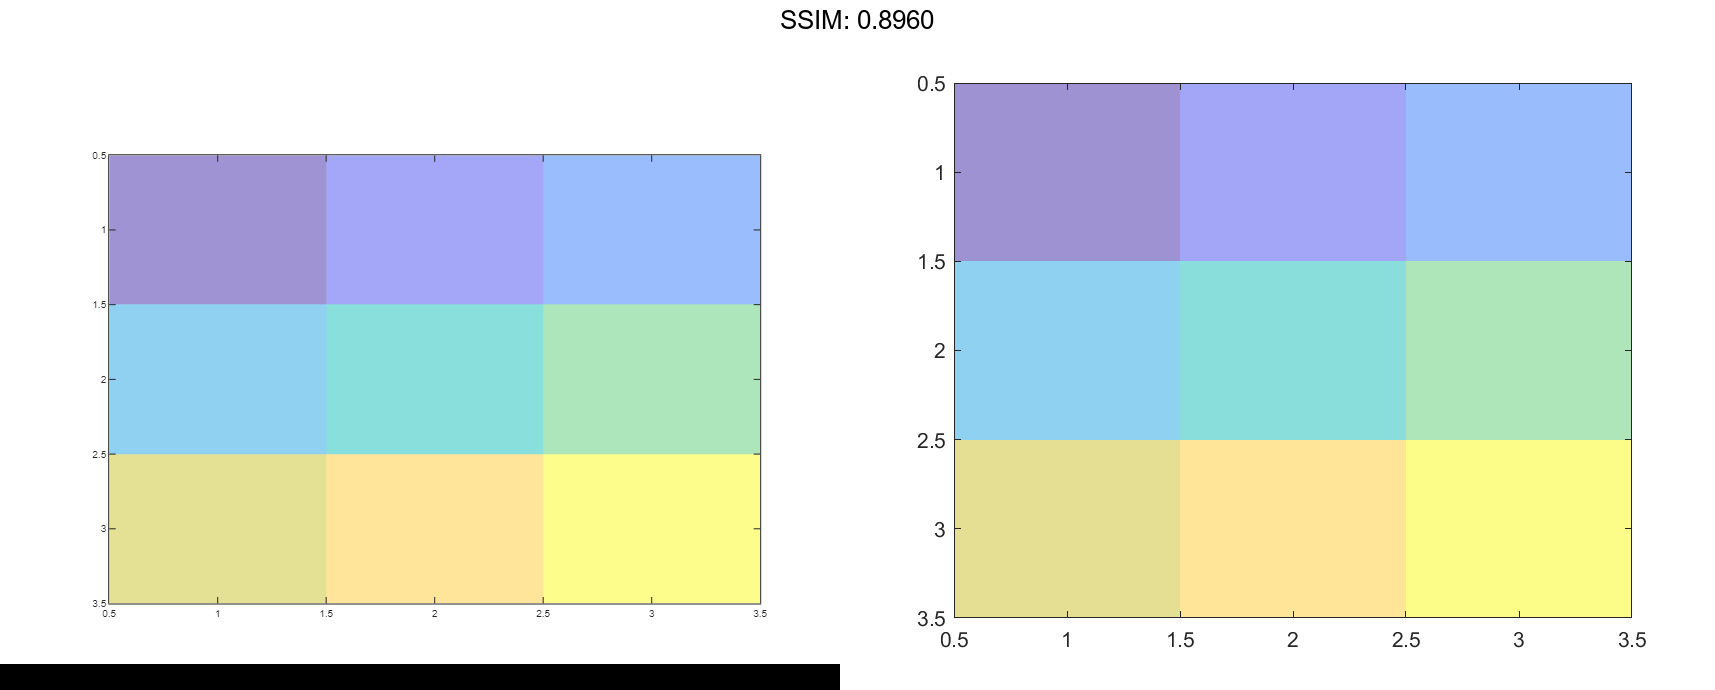
Modify Image After Creation
Create an image and return the image object, im. Then, make the image semitransparent by setting the AlphaData property of the image object.
C = [1 2 3; 4 5 6; 7 8 9]; im = imagesc(C);
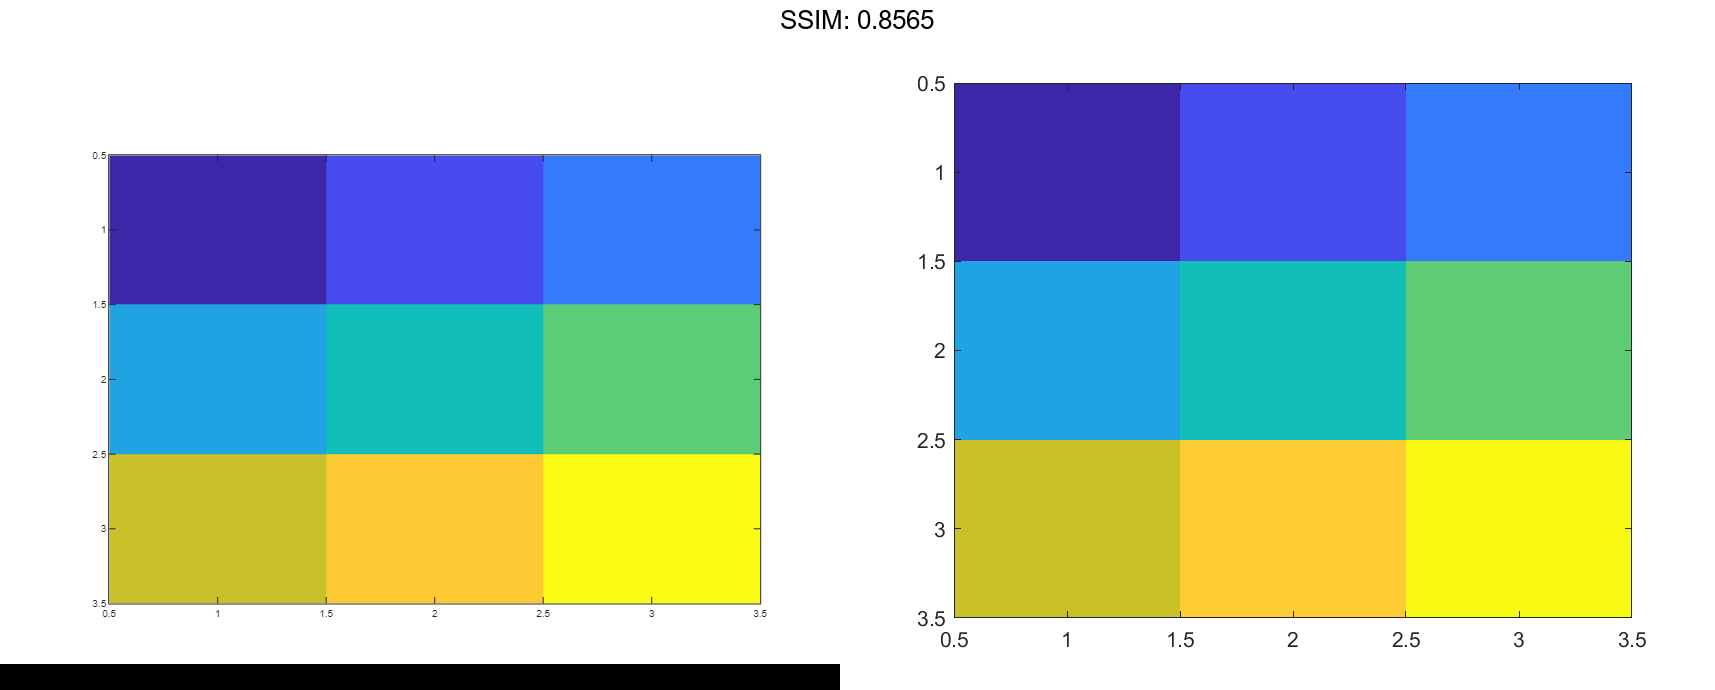
im.AlphaData = .5;

fig2plotly()
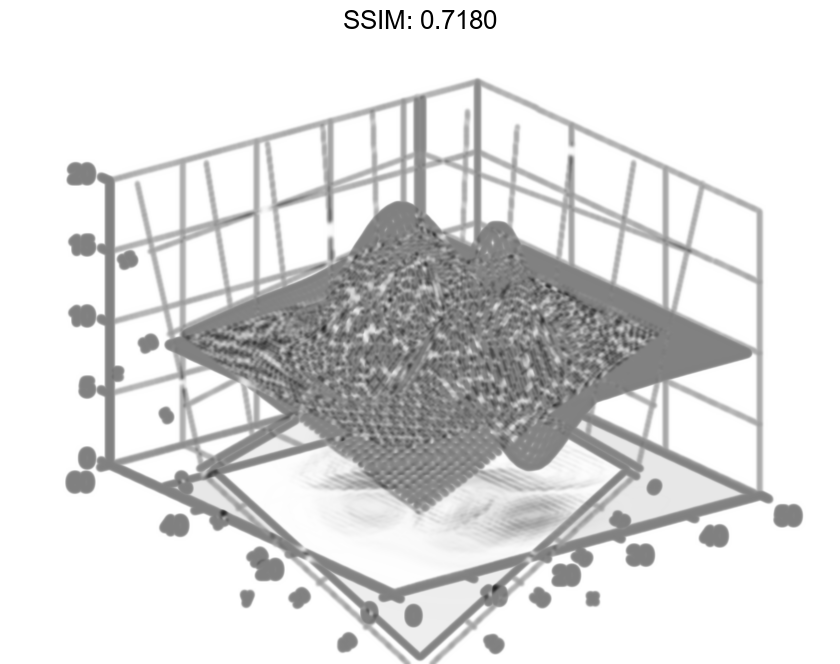
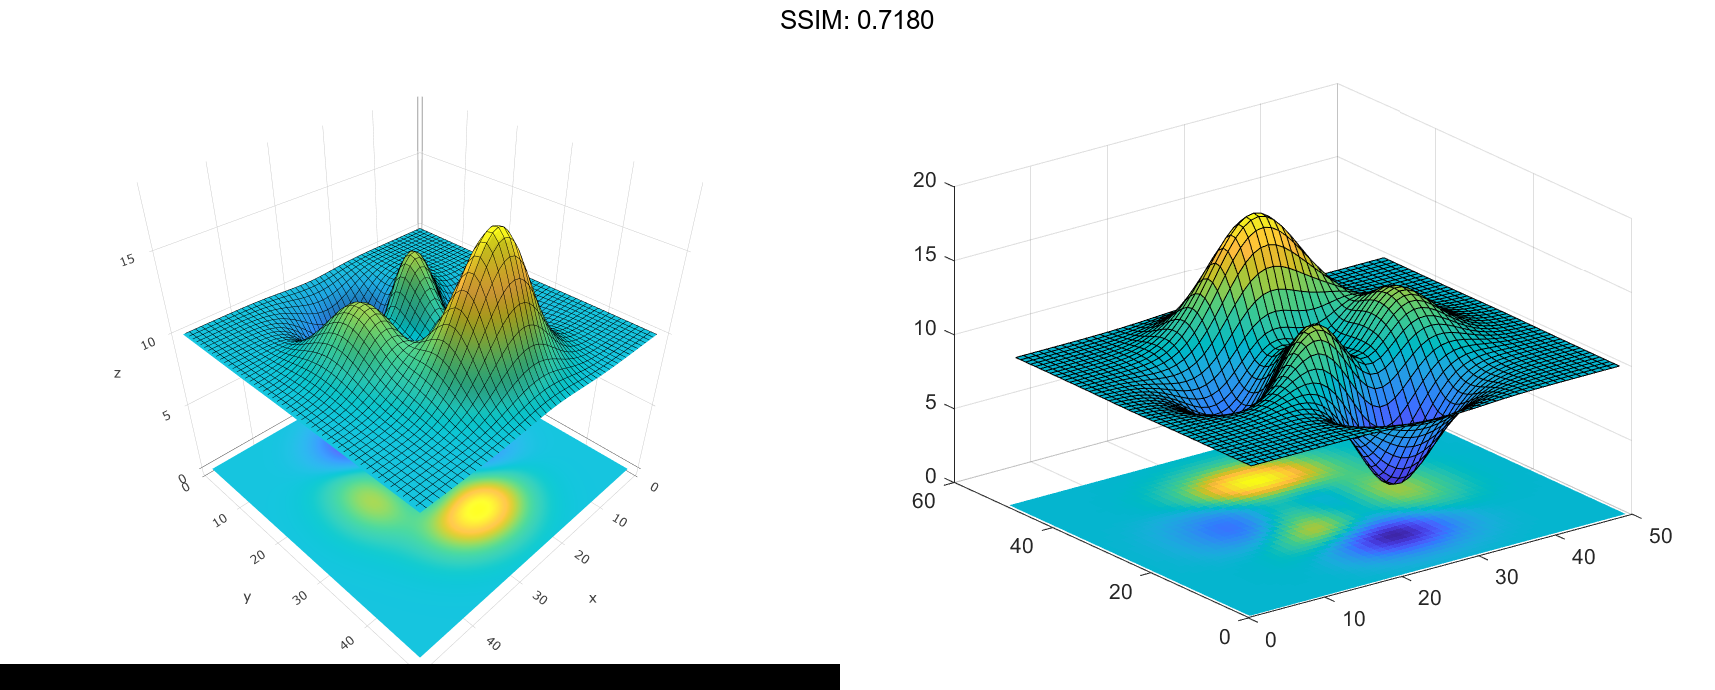
Add Image to Axes in 3-D View
Create a surface plot. Then, add an image under the surface. imagesc displays the image in the xy-plane.
Z = 10 + peaks;
surf(Z)
hold on
imagesc(Z)

fig2plotly()