MATLAB bar3h in MATLAB®
Learn how to make 4 bar3h charts in MATLAB, then publish them to the Web with Plotly.
Create 3-D Horizontal Bar Graph
Load the data set count.dat, which returns a three-column matrix, count. Store Y as the first ten rows of count.
load count.dat Y = count(1:10,:);
Create a 3-D horizontal bar graph of Y. By default, the style is detached.
figure
bar3h(Y)

fig2plotly('TreatAs', 'bar3h')
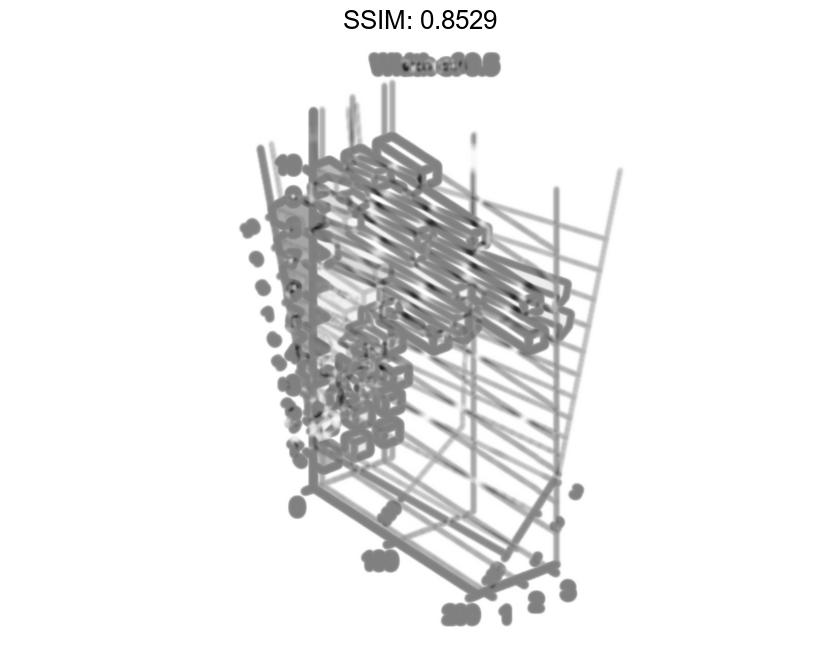
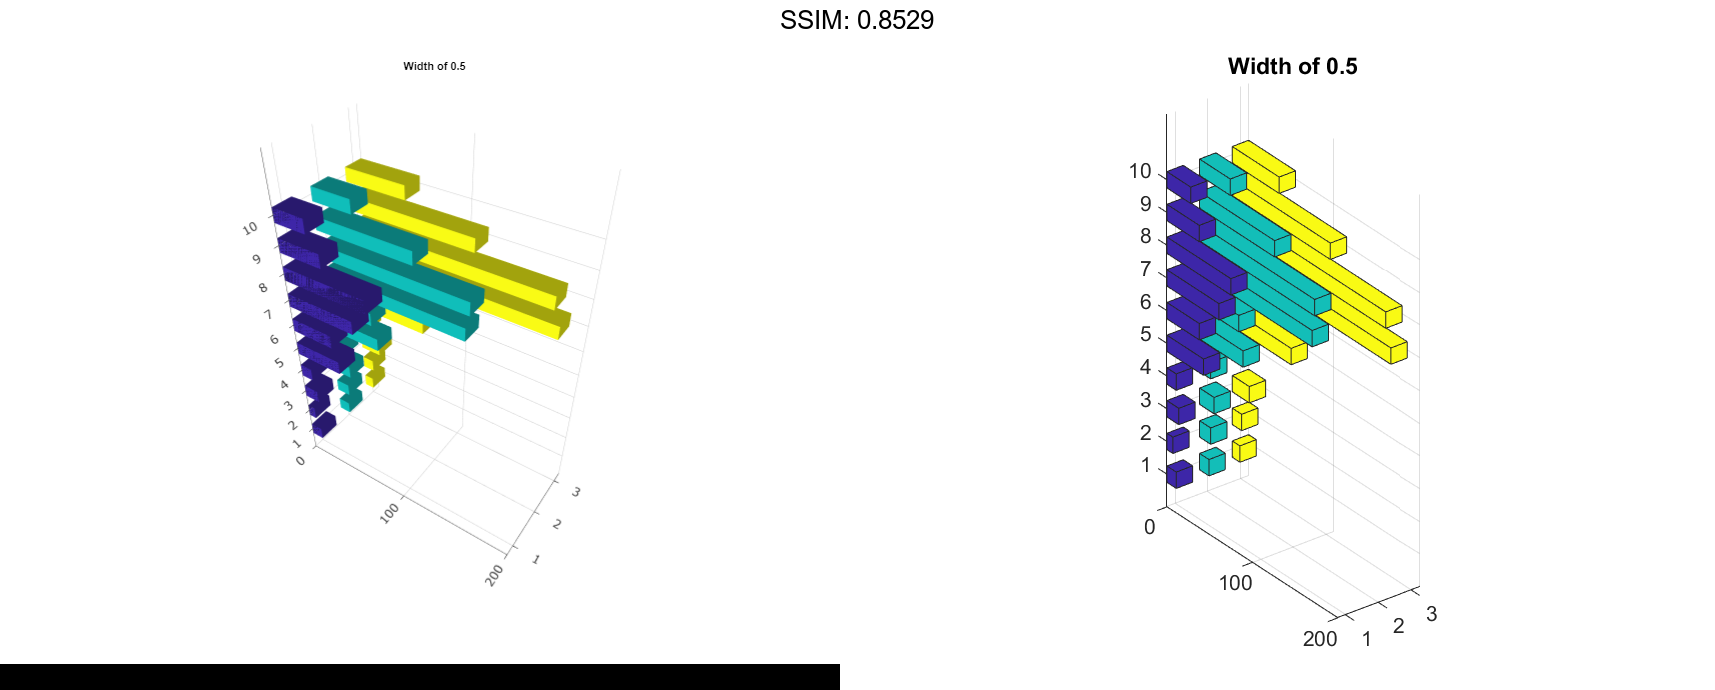
Specify Bar Width for 3-D Horizontal Bar Graph
Load the data set count.dat, which returns a three-column matrix, count. Store Y as the first ten rows of count.
load count.dat; Y = count(1:10,:);
Create a 3-D horizontal bar graph of Y and set the bar width to 0.5.
width = 0.5;

figure
bar3h(Y,width)
title('Width of 0.5')

fig2plotly('TreatAs', 'bar3h')
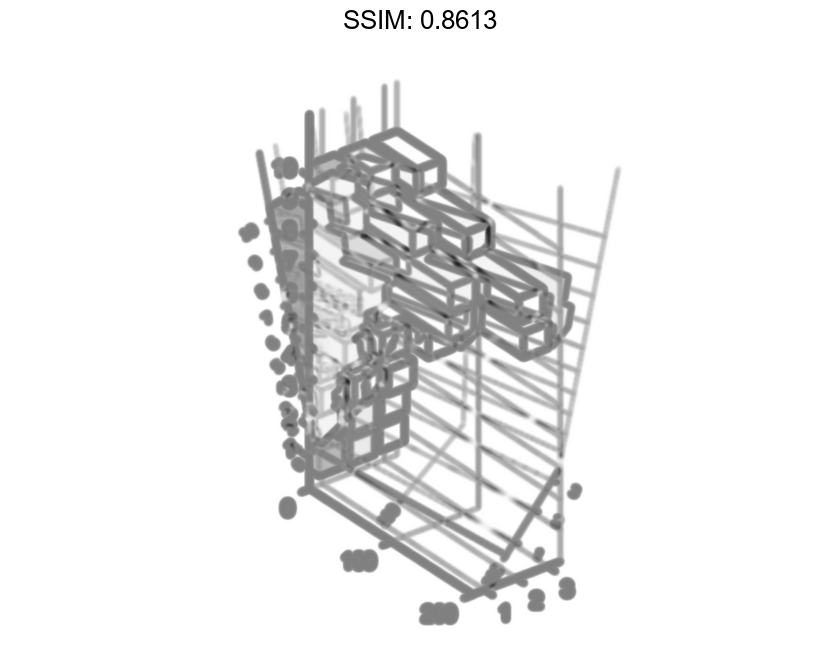
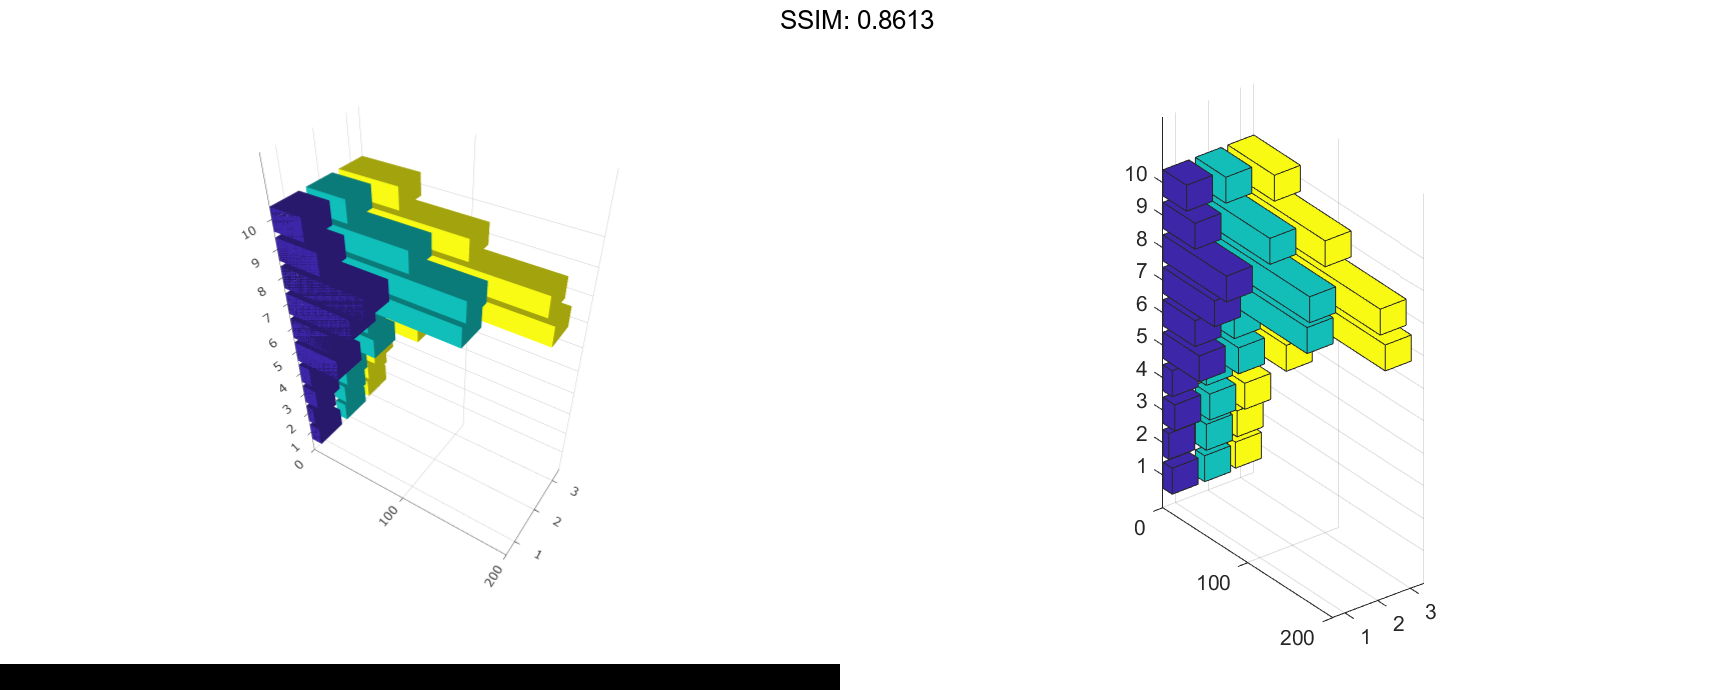
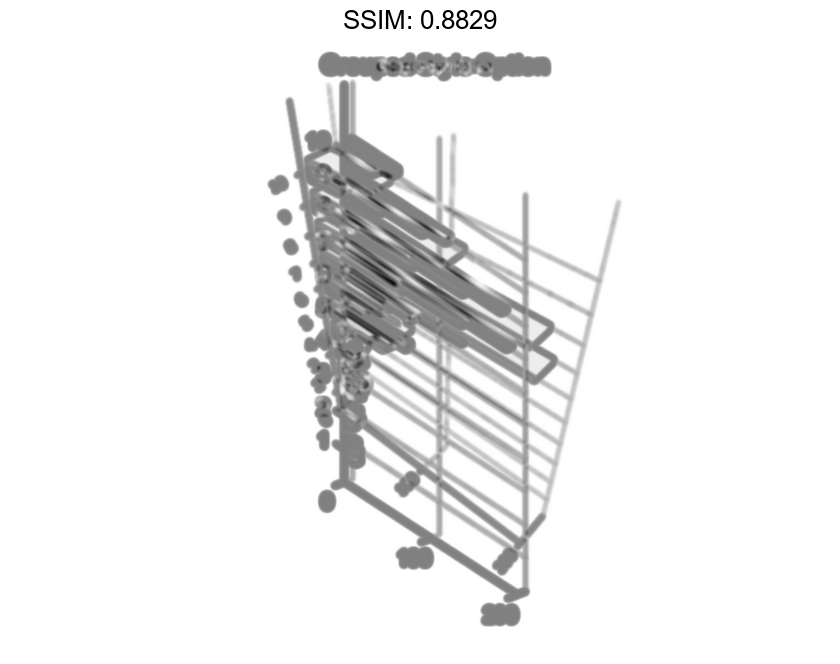
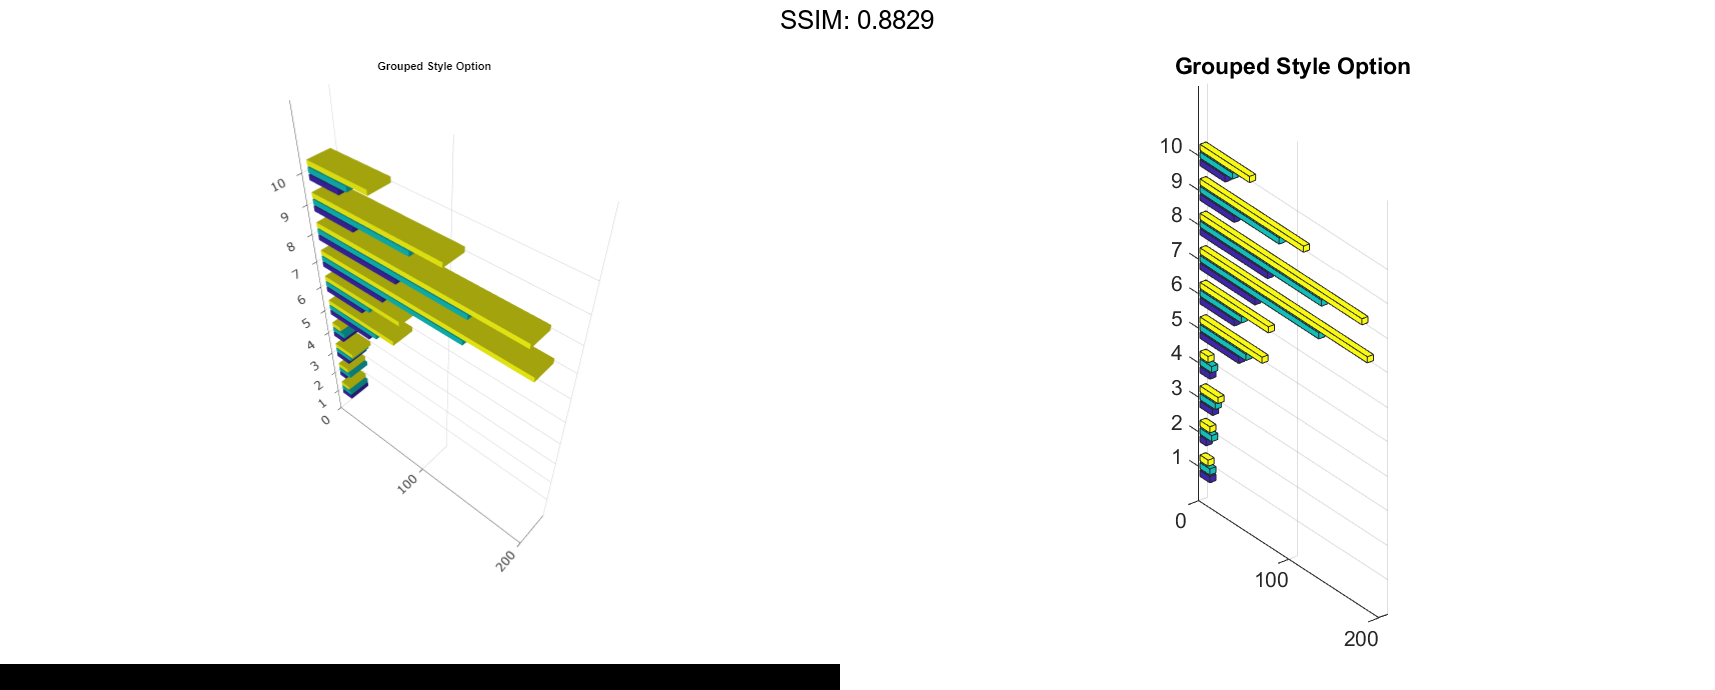
3-D Horizontal Bar Graph with Grouped Style
Load the data set count.dat, which returns a three-column matrix, count. Store Y as the first ten rows of count.
load count.dat Y = count(1:10,:);
Create a 3-D horizontal bar graph of Y and specify the style option as grouped.
figure
bar3h(Y,'grouped')
title('Grouped Style Option')

fig2plotly('TreatAs', 'bar3h')
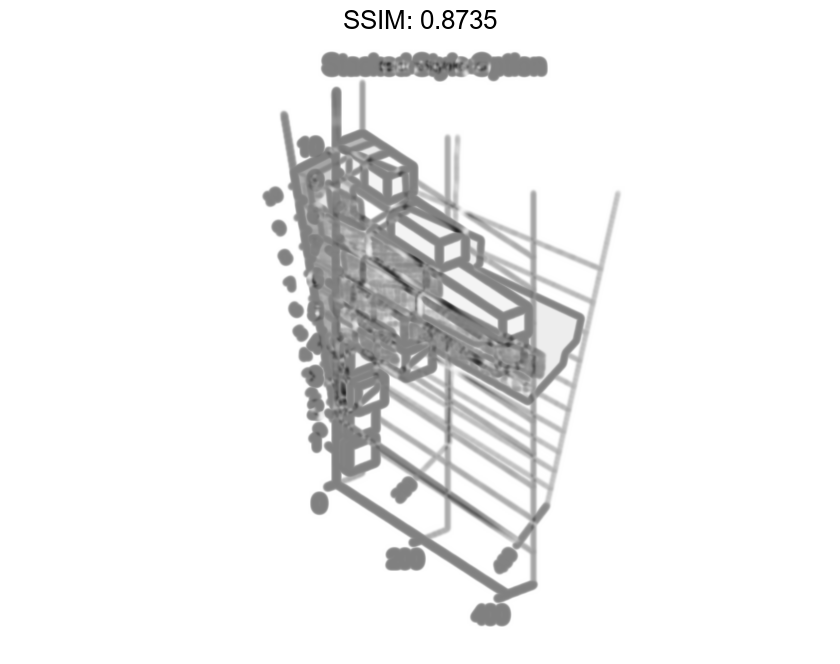
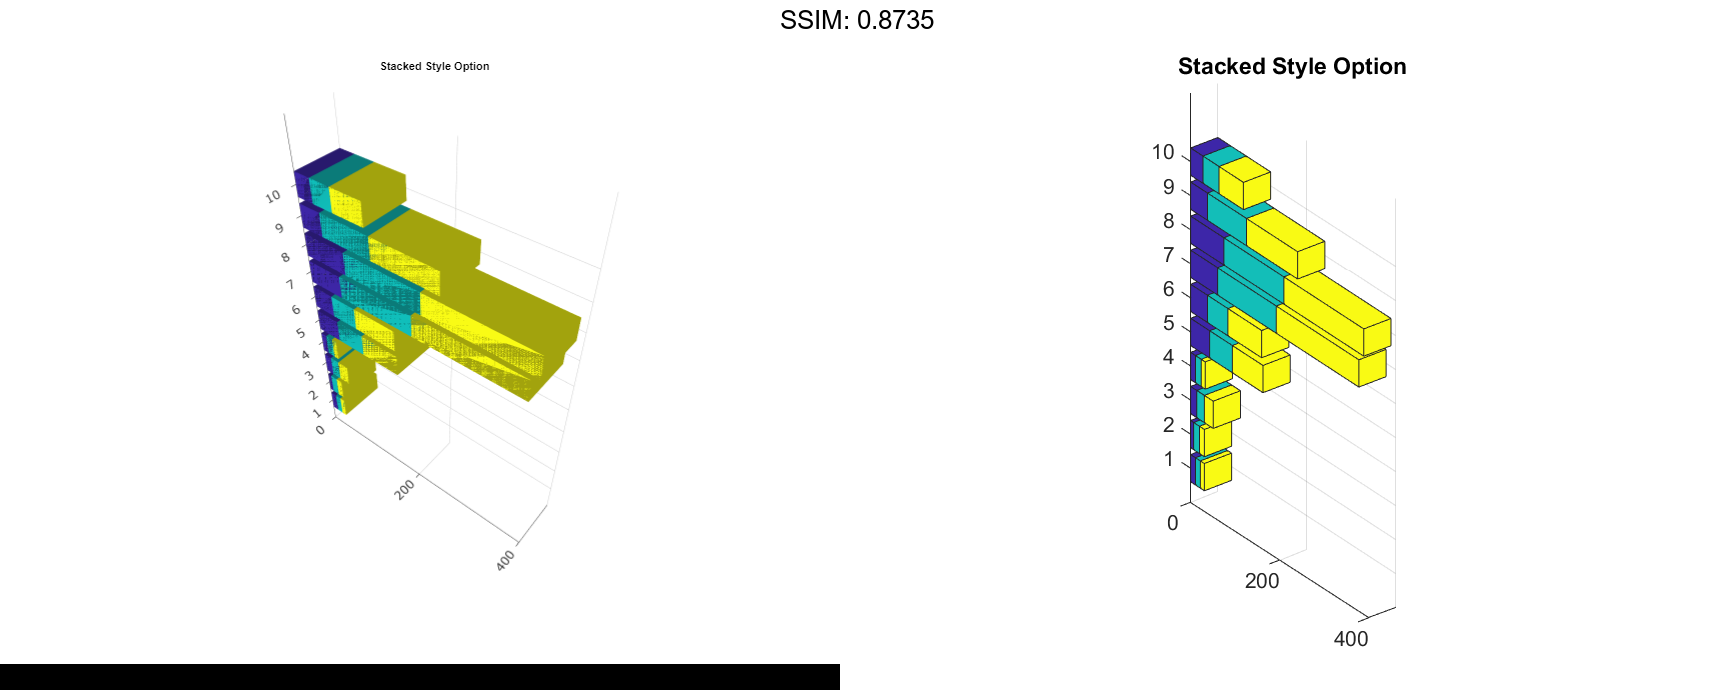
3-D Horizontal Bar Graph with Stacked Option
Load the data set count.dat, which returns a three-column matrix, count. Store Y as the first ten rows of count.
load count.dat Y = count(1:10,:);
Create a 3-D horizontal bar graph of Y and specify the style option as stacked.
figure
bar3h(Y,'stacked')
title('Stacked Style Option')

fig2plotly('TreatAs', 'bar3h')