

MATLAB histogram in MATLAB®
Learn how to make 10 histogram charts in MATLAB, then publish them to the Web with Plotly.
Histogram of Vector
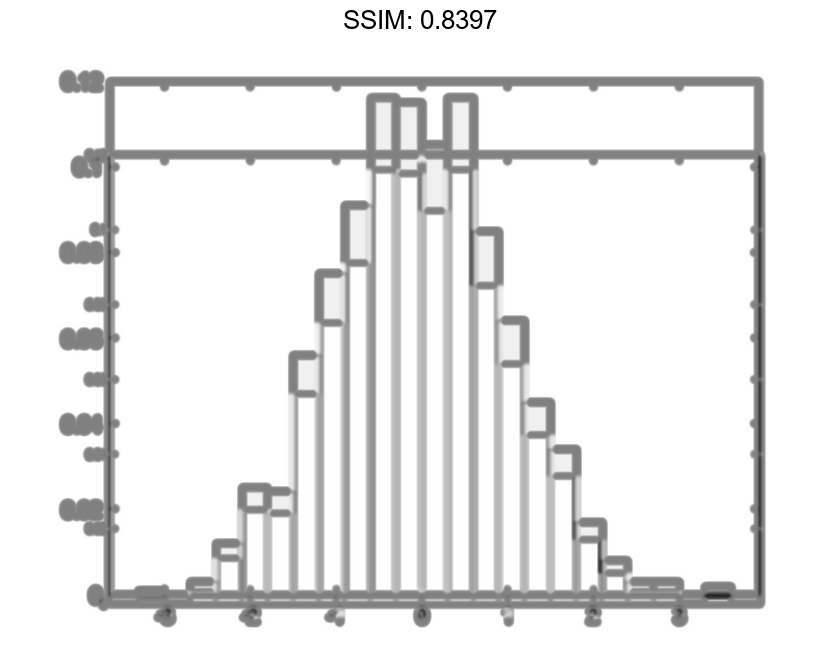
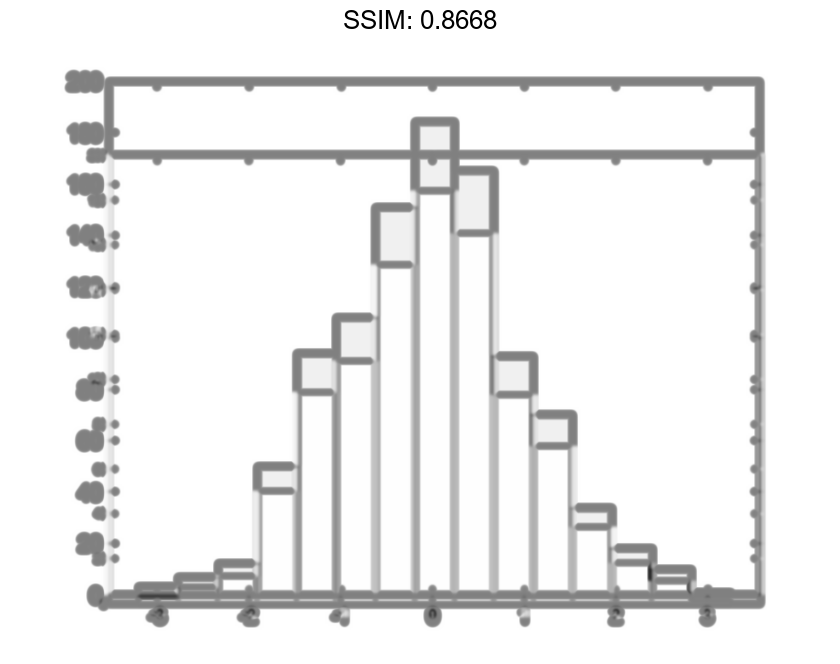
Generate 10,000 random numbers and create a histogram. The histogram function automatically chooses an appropriate number of bins to cover the range of values in x and show the shape of the underlying distribution.
x = randn(10000,1); h = histogram(x)
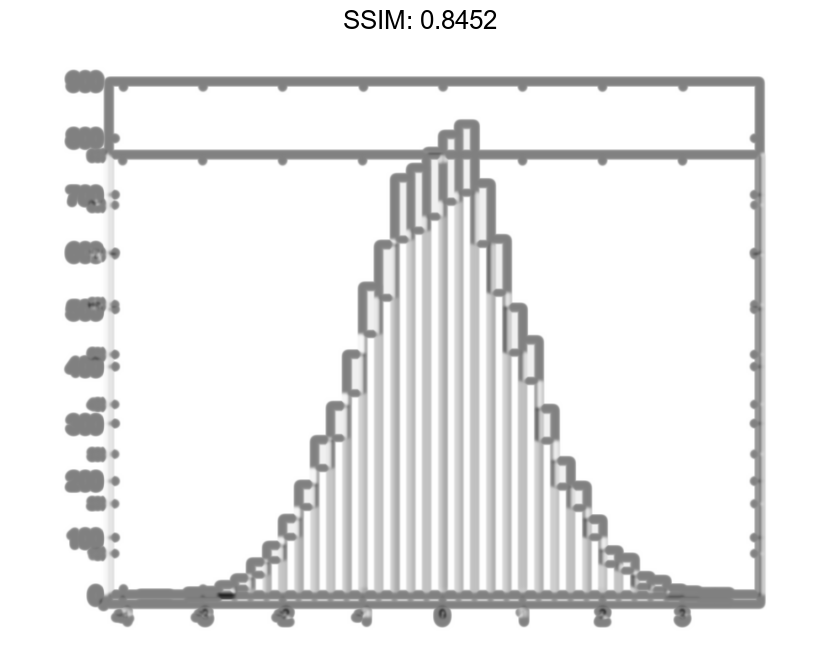
h =
  Histogram with properties:

             Data: [10000x1 double]
           Values: [1x37 double]
          NumBins: 37
         BinEdges: [1x38 double]
         BinWidth: 0.2000
        BinLimits: [-3.8000 3.6000]
    Normalization: 'count'
        FaceColor: 'auto'
        EdgeColor: [0 0 0]

  Show all properties
nbins = h.NumBins

fig2plotly()
nbins = 37
h =
  Histogram with properties:

             Data: [1000x1 double]
           Values: [1x25 double]
          NumBins: 25
         BinEdges: [1x26 double]
         BinWidth: 0.2800
        BinLimits: [-3.4000 3.6000]
    Normalization: 'count'
        FaceColor: 'auto'
        EdgeColor: [0 0 0]

  Show all properties
counts = h.Values

fig2plotly()
counts = 1×25

     1     3     0     6    14    19    31    54    74    80    92   122   104   115    88    80    38    32    21     9     5     5     5     0     2
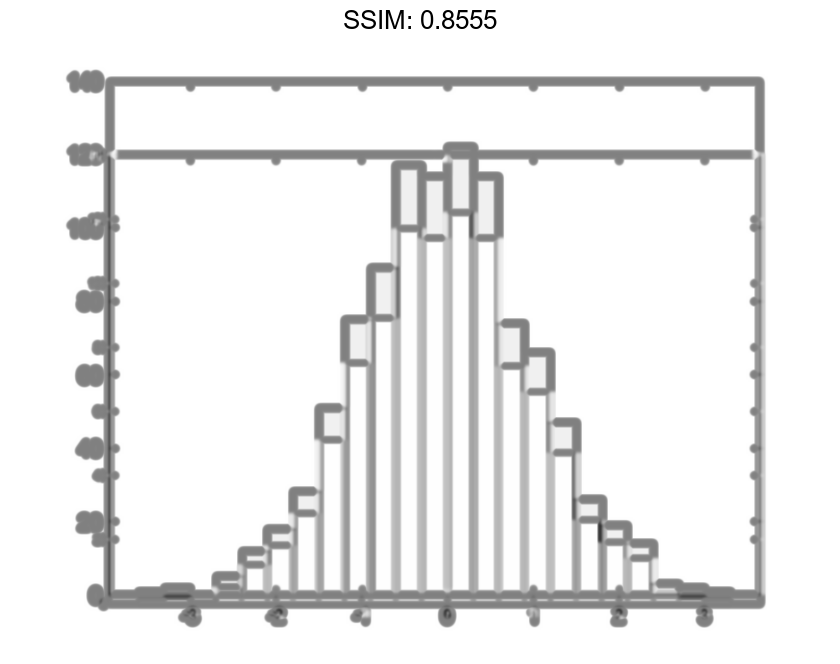
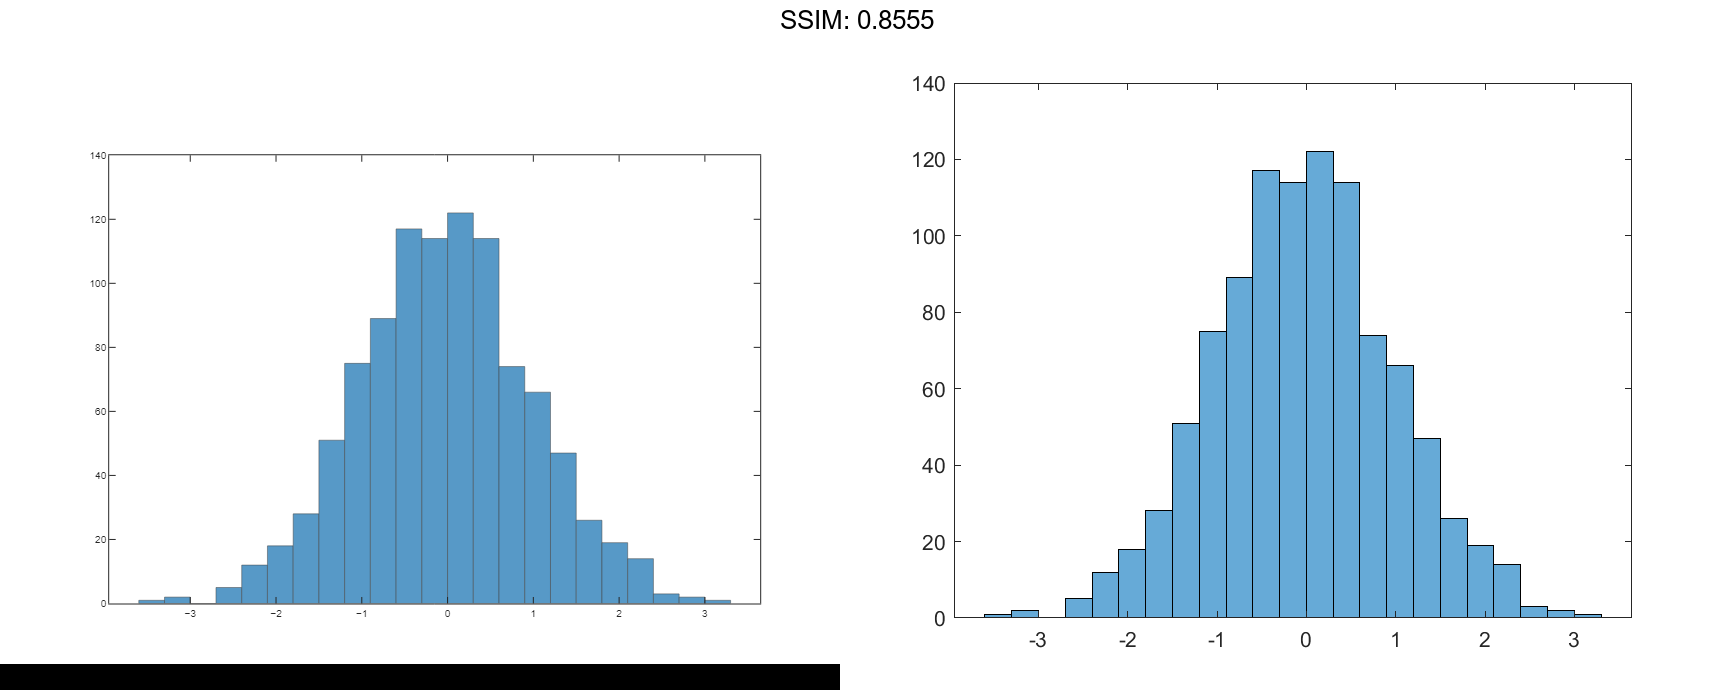
h =
  Histogram with properties:

             Data: [1000x1 double]
           Values: [1x23 double]
          NumBins: 23
         BinEdges: [1x24 double]
         BinWidth: 0.3000
        BinLimits: [-3.3000 3.6000]
    Normalization: 'count'
        FaceColor: 'auto'
        EdgeColor: [0 0 0]

  Show all properties
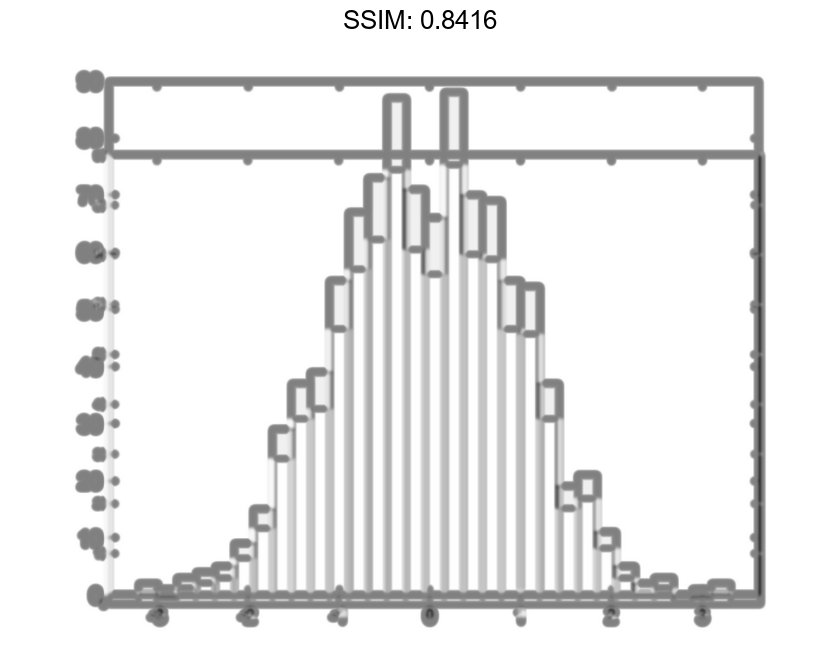
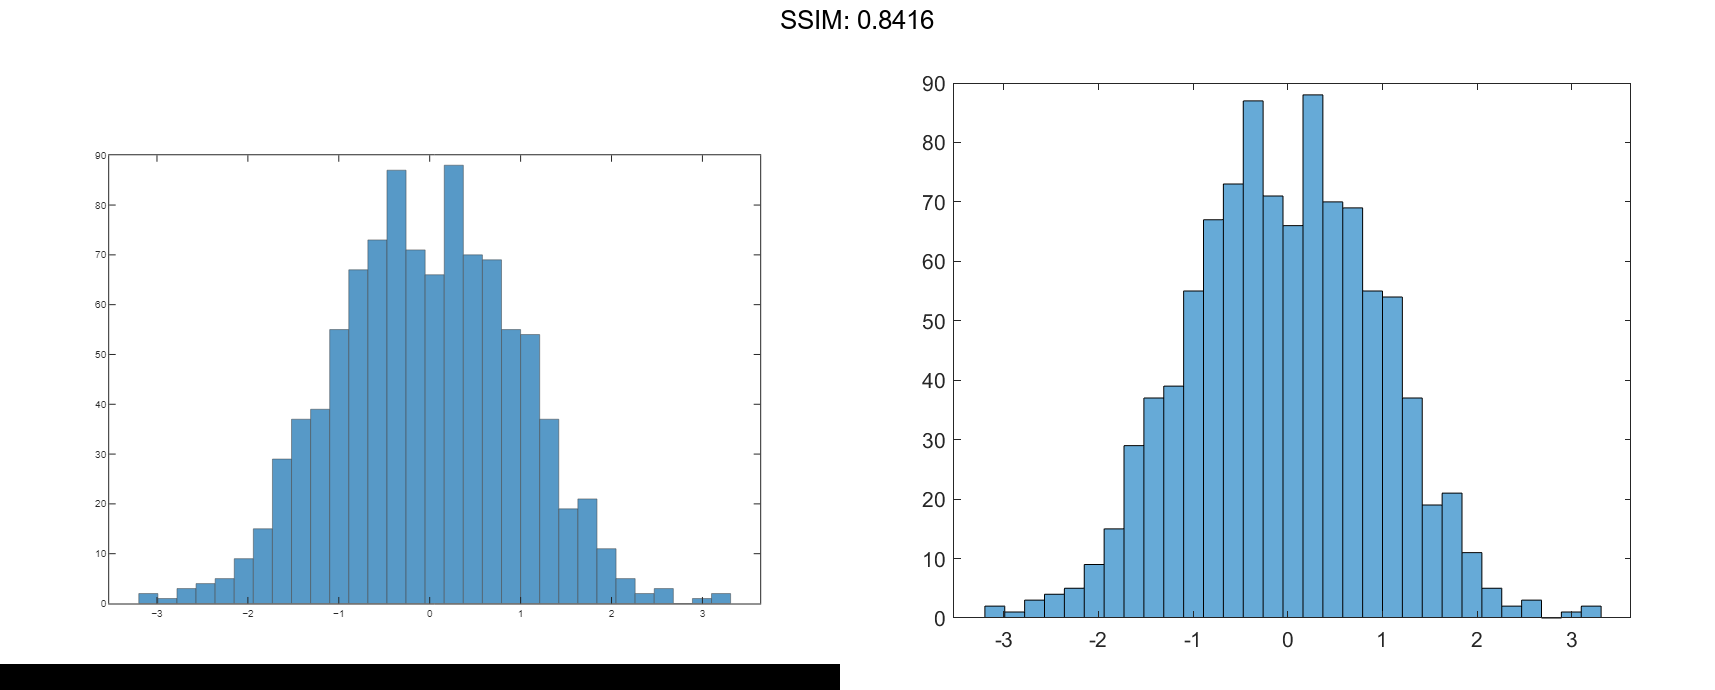
Nbins = morebins(h);
Nbins = morebins(h)

fig2plotly()
Nbins = 29
h.NumBins = 31;

fig2plotly()
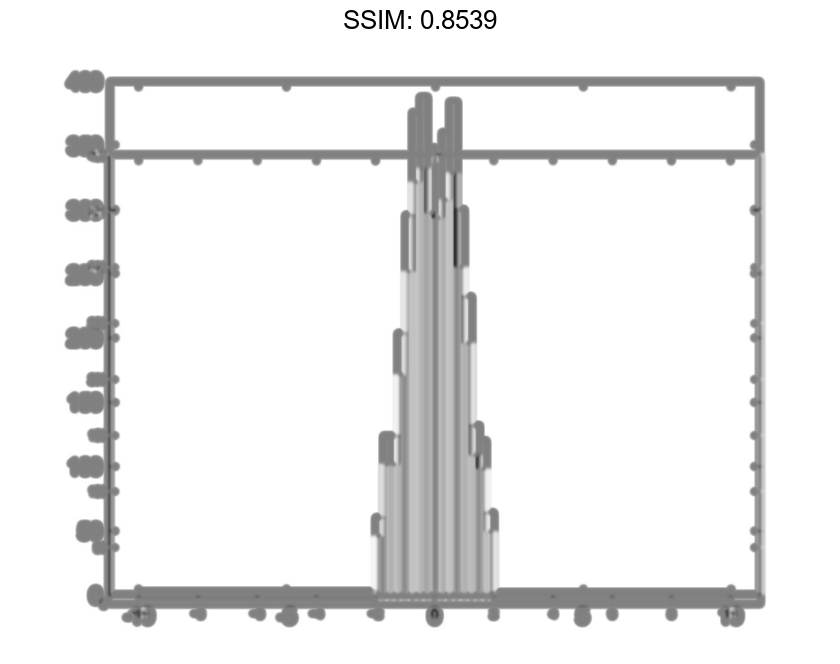
Specify Bin Edges of Histogram
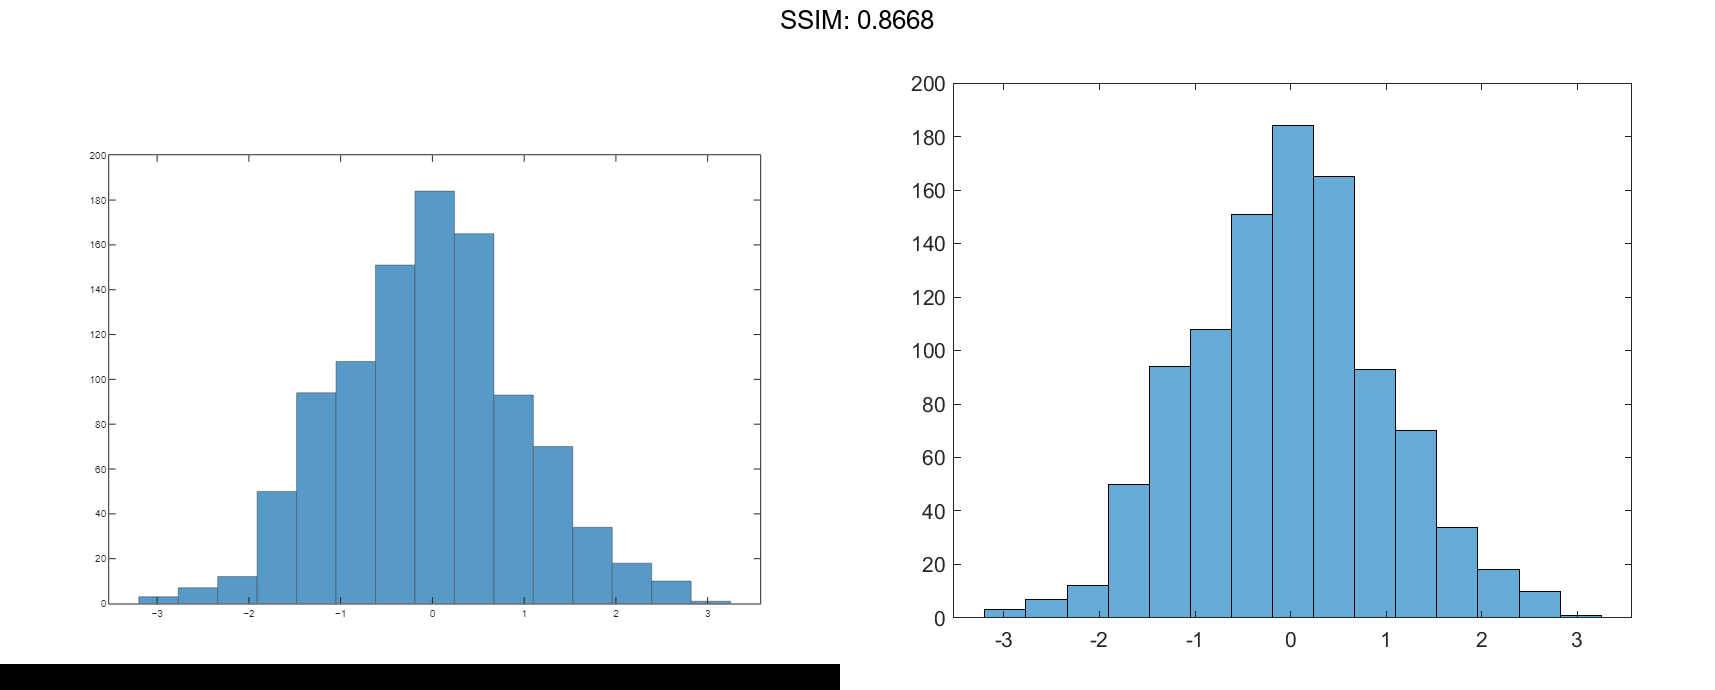
Generate 1,000 random numbers and create a histogram. Specify the bin edges as a vector with wide bins on the edges of the histogram to capture the outliers that do not satisfy |x|<2. The first vector element is the left edge of the first bin, and the last vector element is the right edge of the last bin.
x = randn(1000,1); edges = [-10 -2:0.25:2 10]; h = histogram(x,edges);
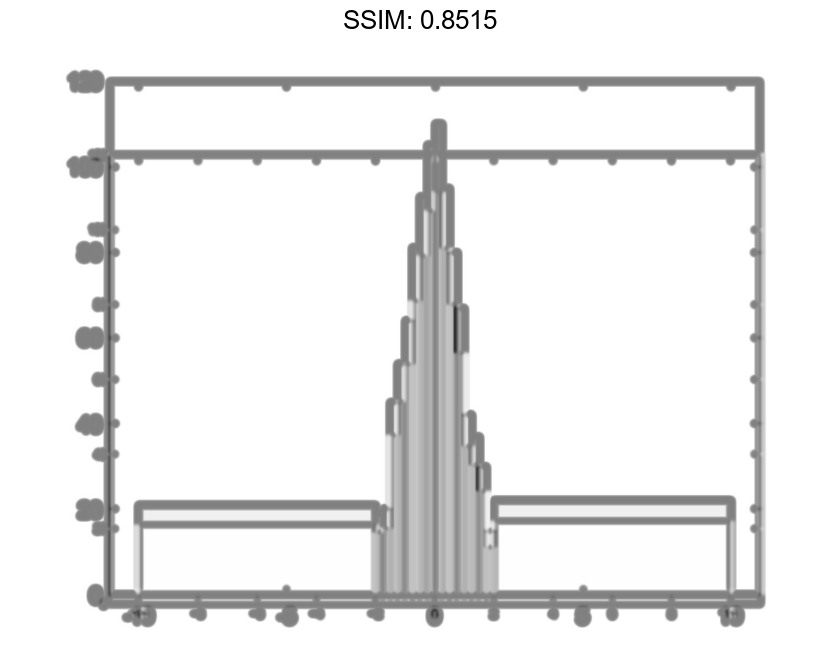
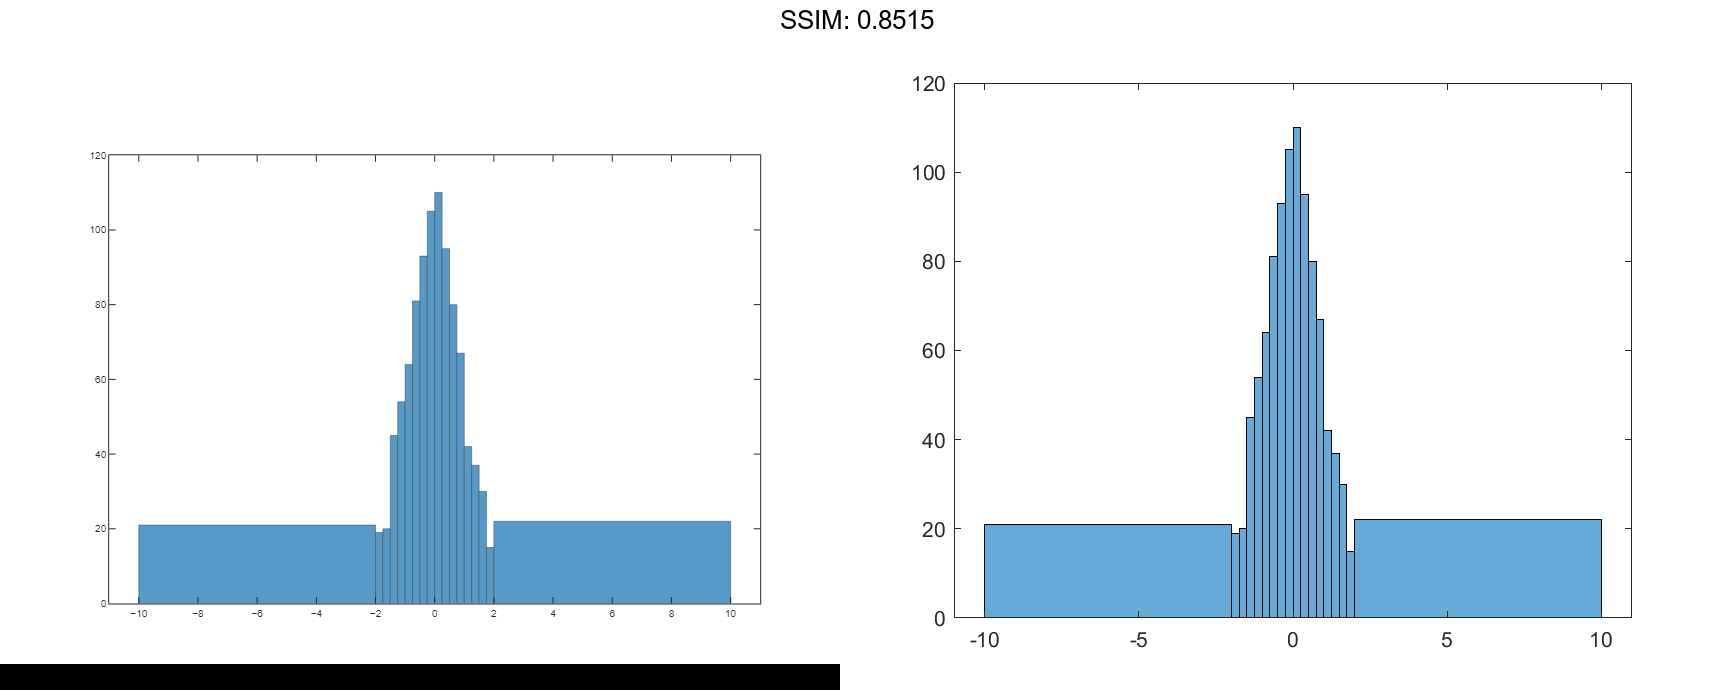
Specify the Normalization property as 'countdensity' to flatten out the bins containing the outliers. Now, the area of each bin (rather than the height) represents the frequency of observations in that interval.
h.Normalization = 'countdensity';

fig2plotly()
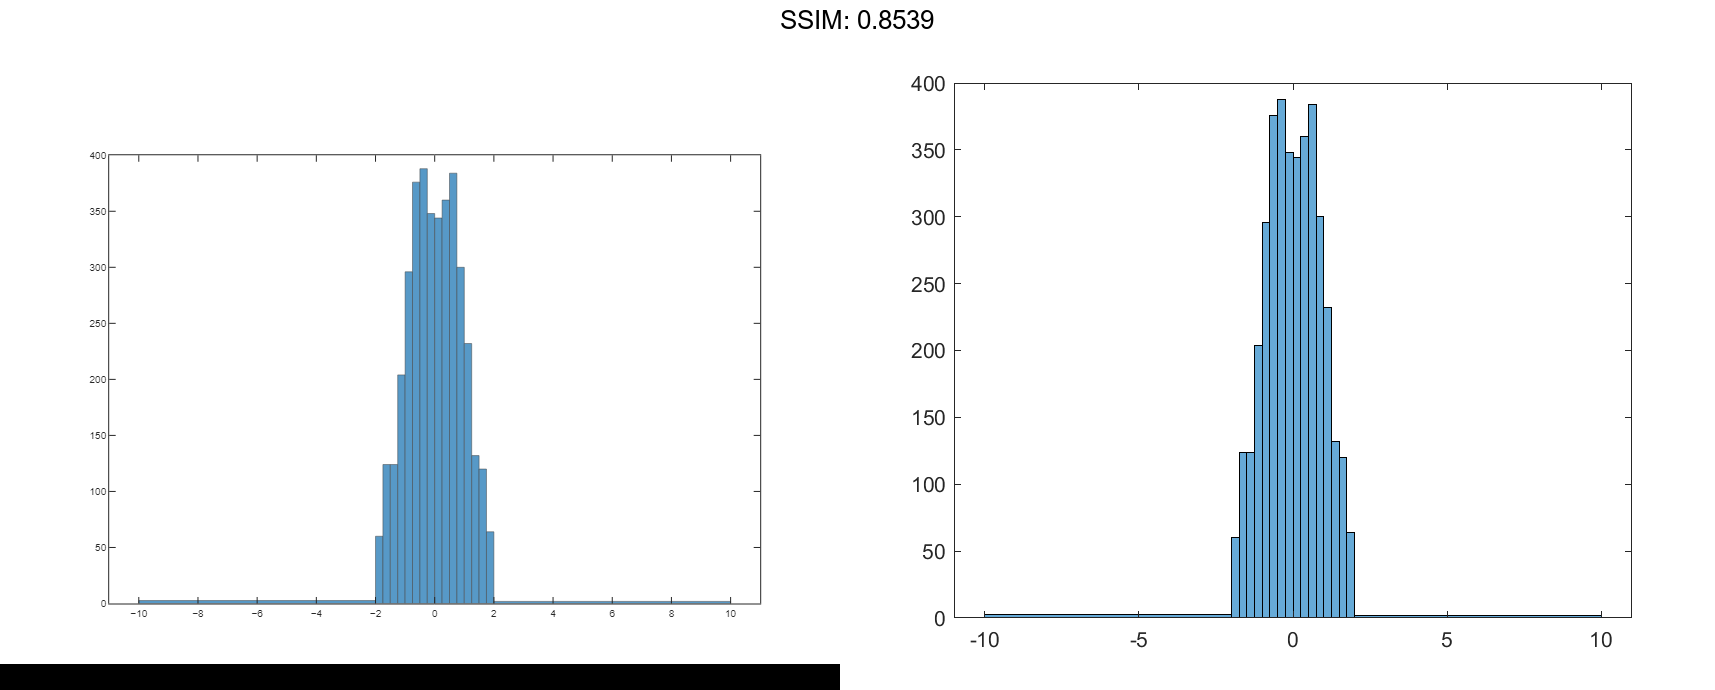
Plot Categorical Histogram
Create a categorical vector that represents votes. The categories in the vector are 'yes', 'no', or 'undecided'.
A = [0 0 1 1 1 0 0 0 0 NaN NaN 1 0 0 0 1 0 1 0 1 0 0 0 1 1 1 1]; C = categorical(A,[1 0 NaN],{'yes','no','undecided'})
C = 1x27 categorical
  Columns 1 through 9

     no      no      yes      yes      yes      no      no      no      no

  Columns 10 through 16

     undecided      undecided      yes      no      no      no      yes

  Columns 17 through 25

     no      yes      no      yes      no      no      no      yes      yes

  Columns 26 through 27

     yes      yes
h =
  Histogram with properties:

              Data: [1x27 categorical]
            Values: [11 14 2]
    NumDisplayBins: 3
        Categories: {'yes'  'no'  'undecided'}
      DisplayOrder: 'data'
     Normalization: 'count'
      DisplayStyle: 'bar'
         FaceColor: 'auto'
         EdgeColor: [0 0 0]

  Show all properties
h =
  Histogram with properties:

             Data: [1000x1 double]
           Values: [1x23 double]
          NumBins: 23
         BinEdges: [1x24 double]
         BinWidth: 0.3000
        BinLimits: [-3.3000 3.6000]
    Normalization: 'probability'
        FaceColor: 'auto'
        EdgeColor: [0 0 0]

  Show all properties
S = sum(h.Values)

fig2plotly()
S = 1
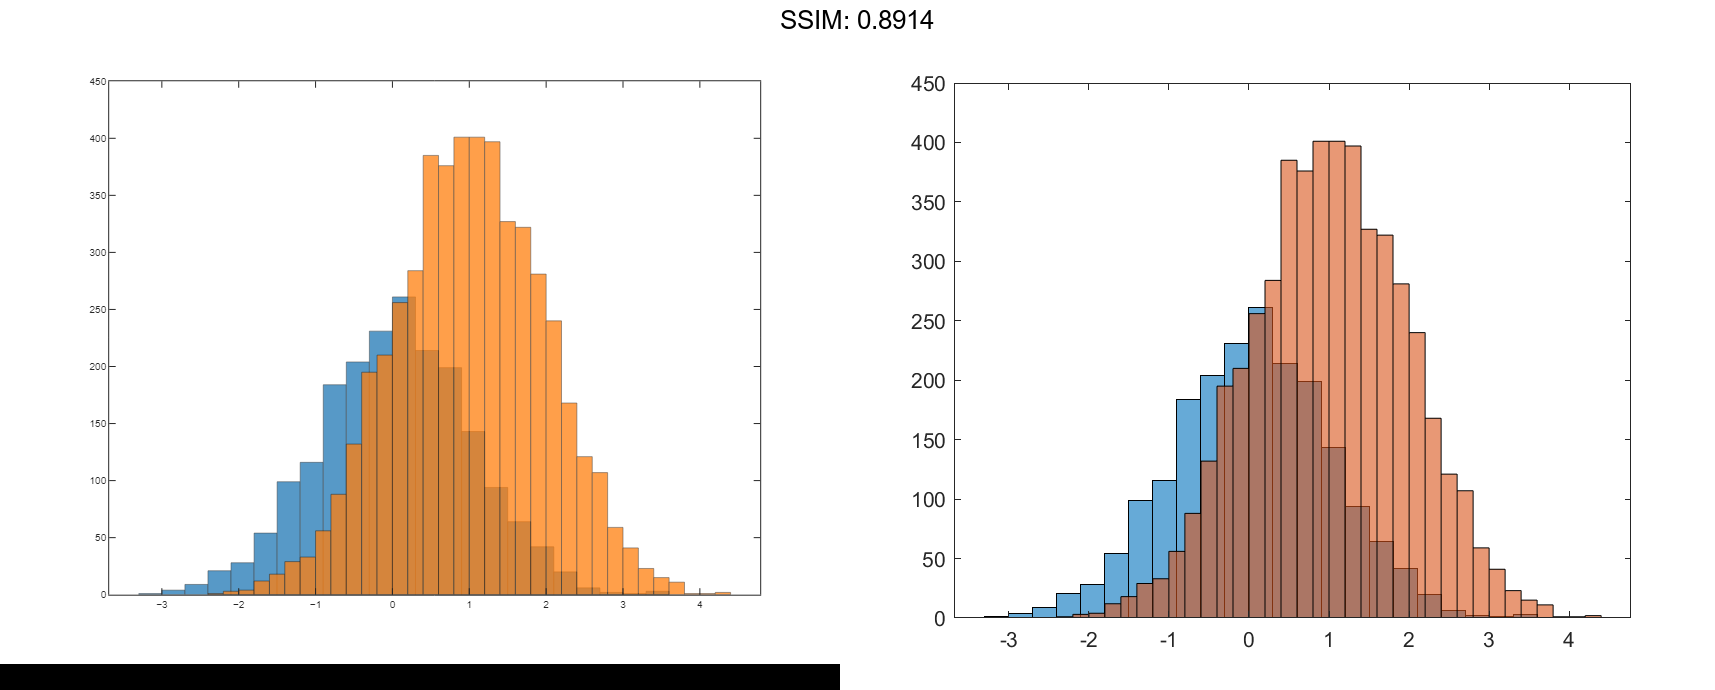
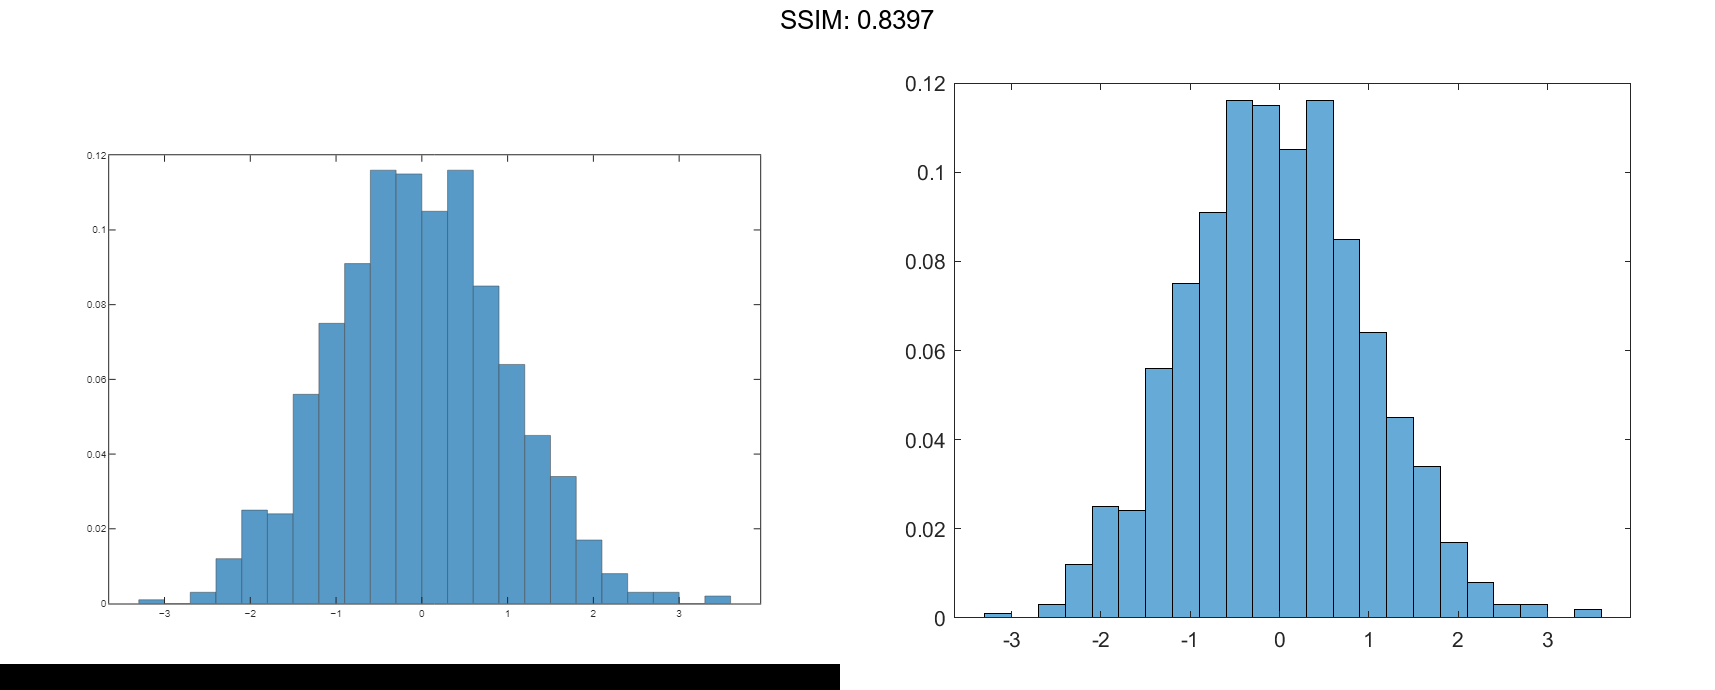
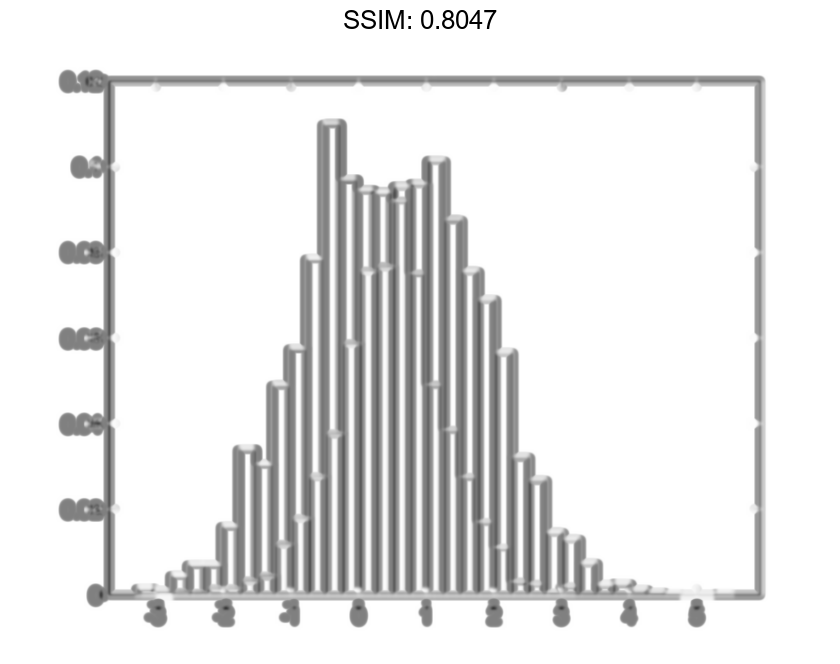
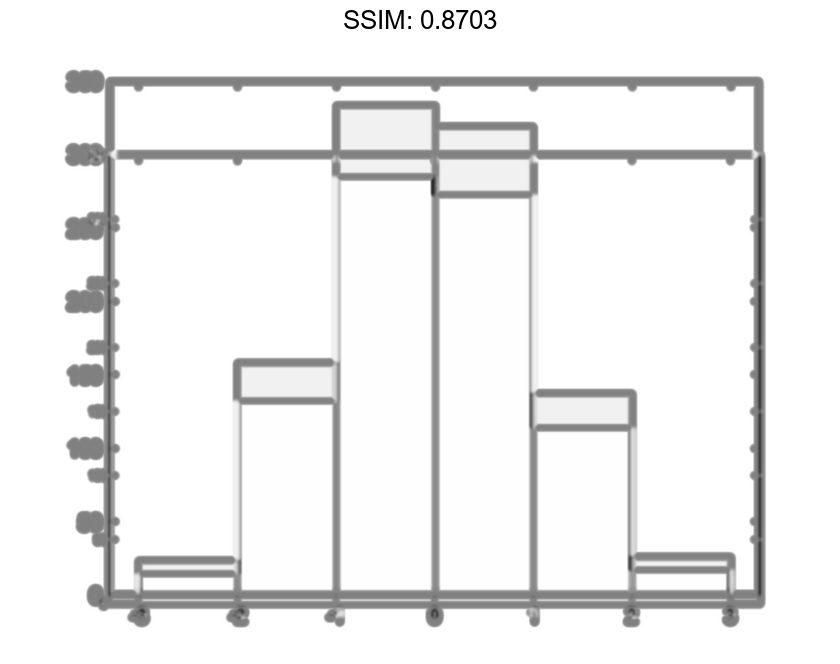
Since the sample size and bin width of the histograms are different, it is difficult to compare them. Normalize the histograms so that all of the bar heights add to 1, and use a uniform bin width.
h1.Normalization = 'probability';
h1.BinWidth = 0.25;
h2.Normalization = 'probability';
h2.BinWidth = 0.25;

fig2plotly()
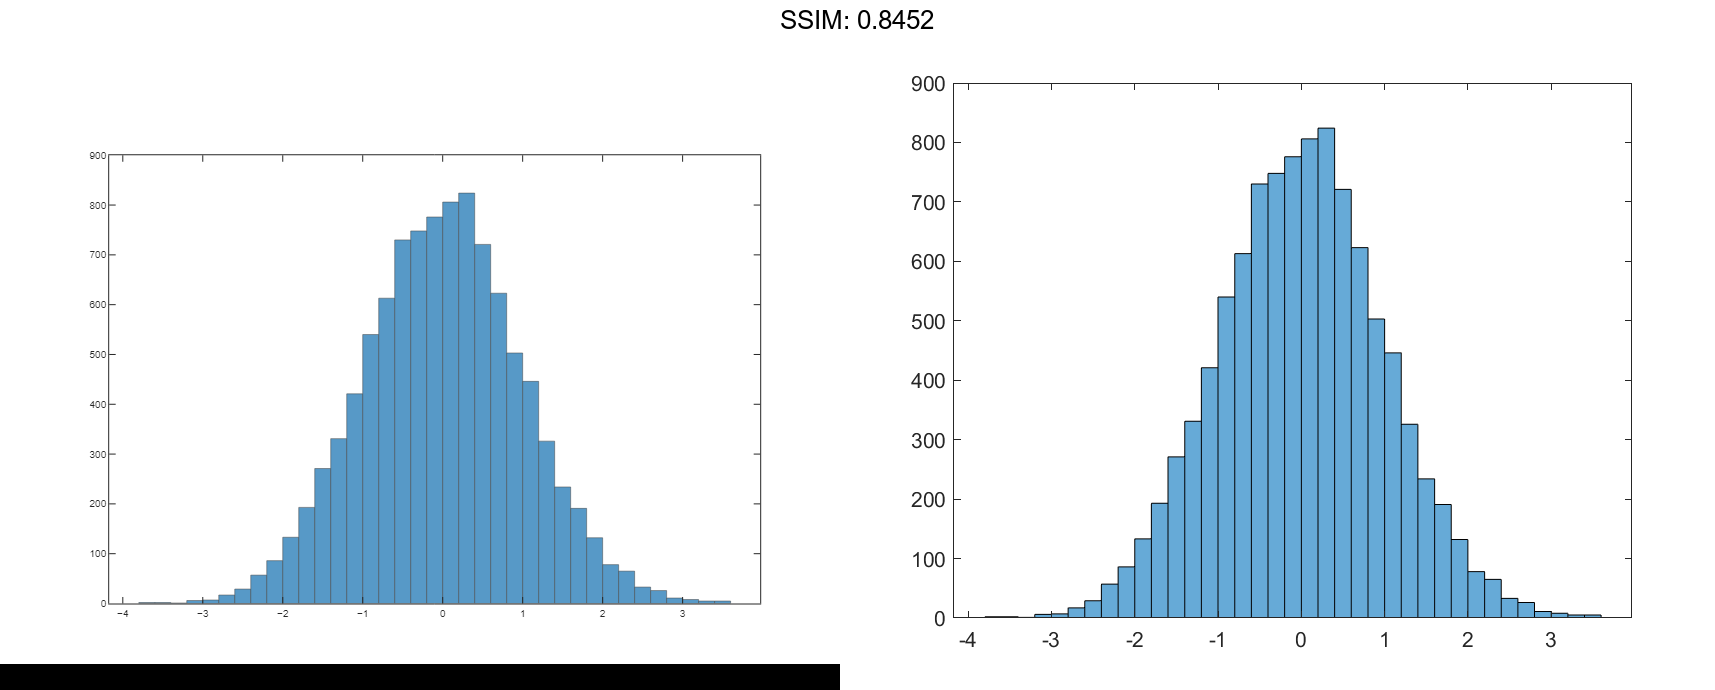
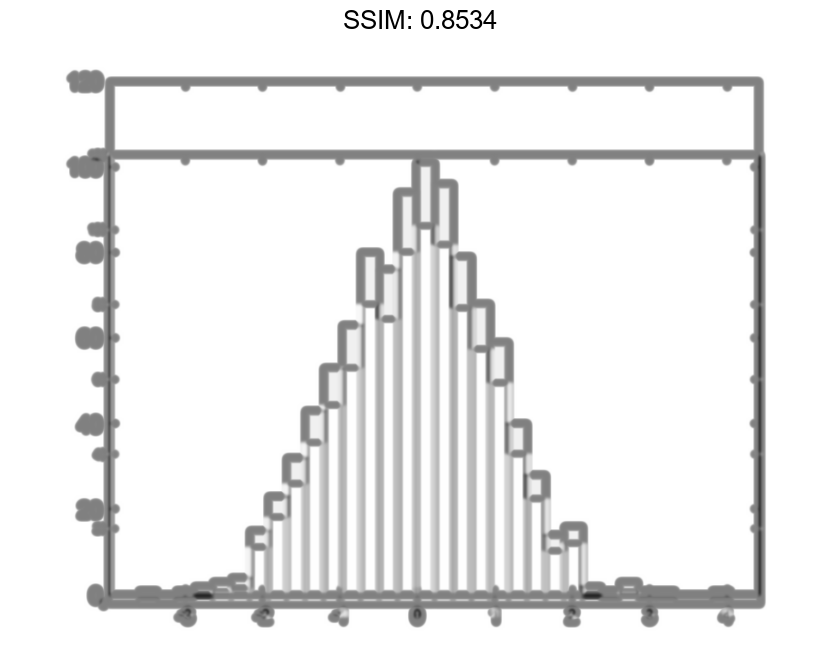
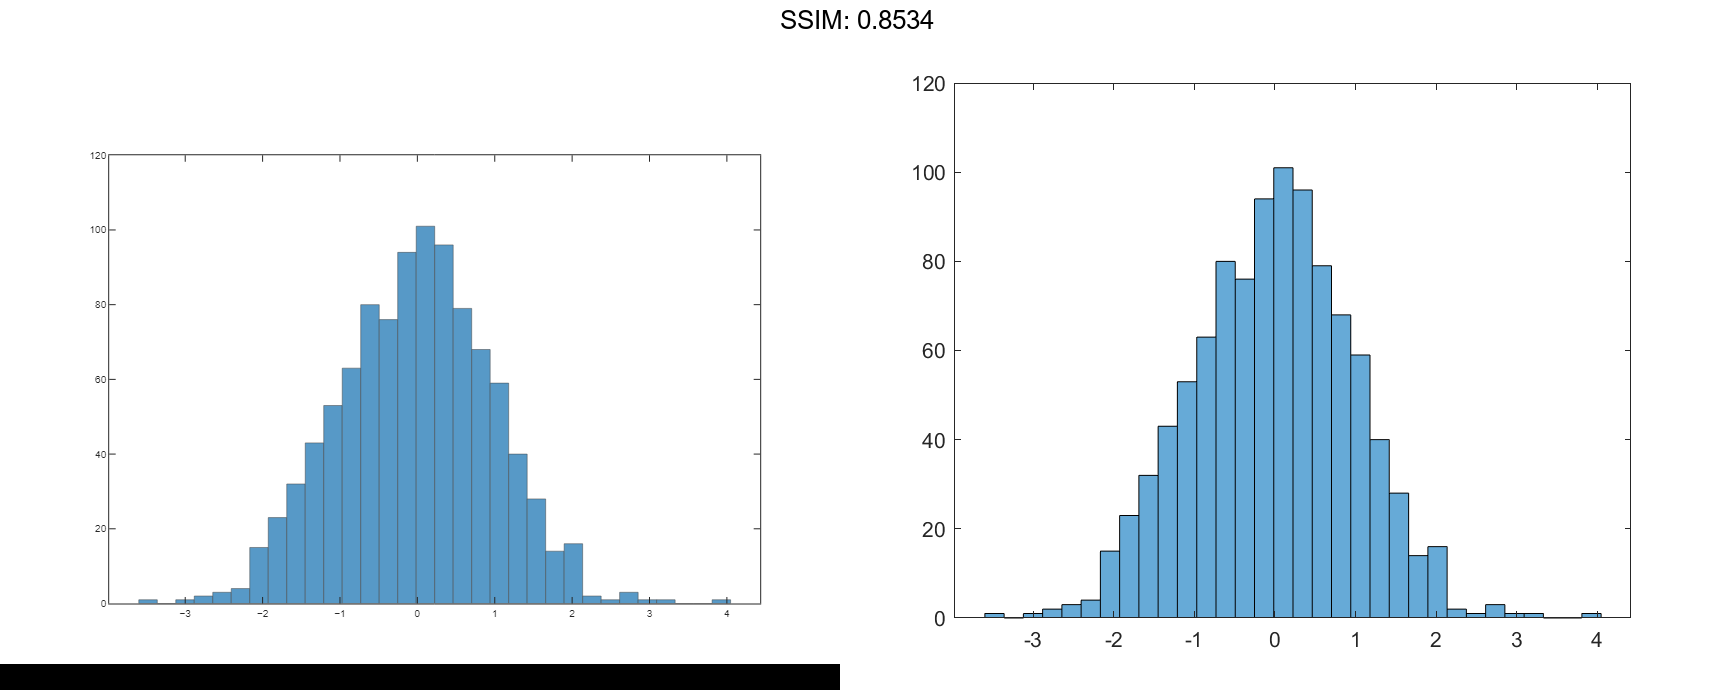
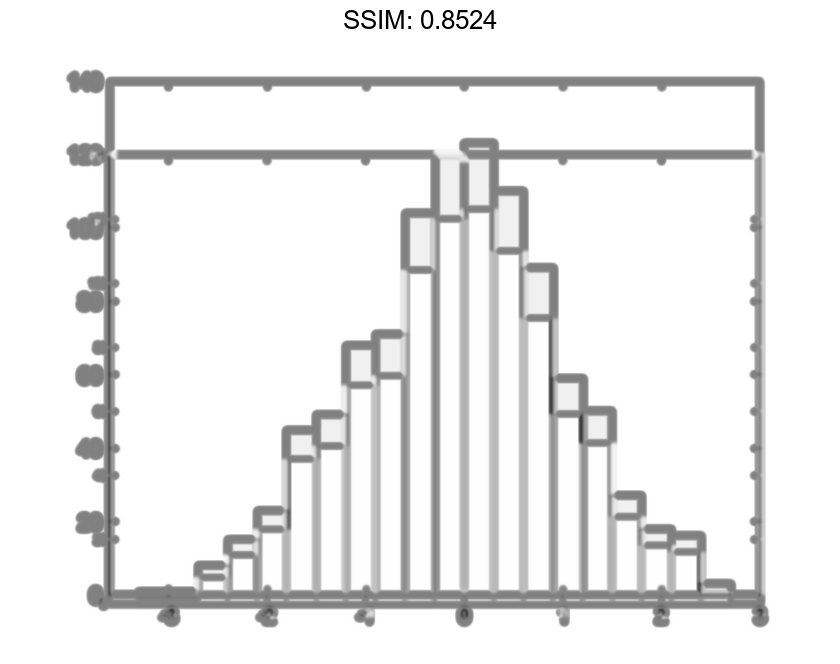
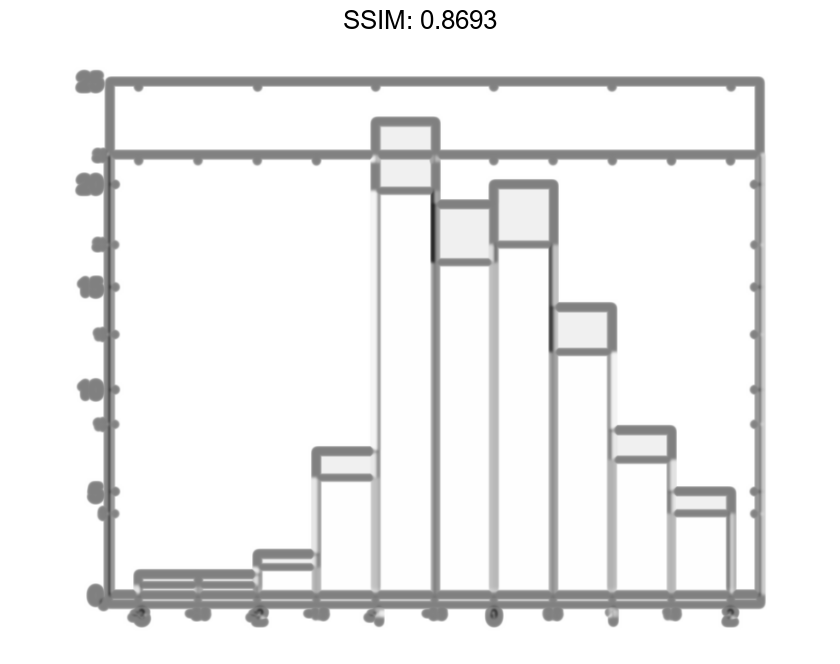
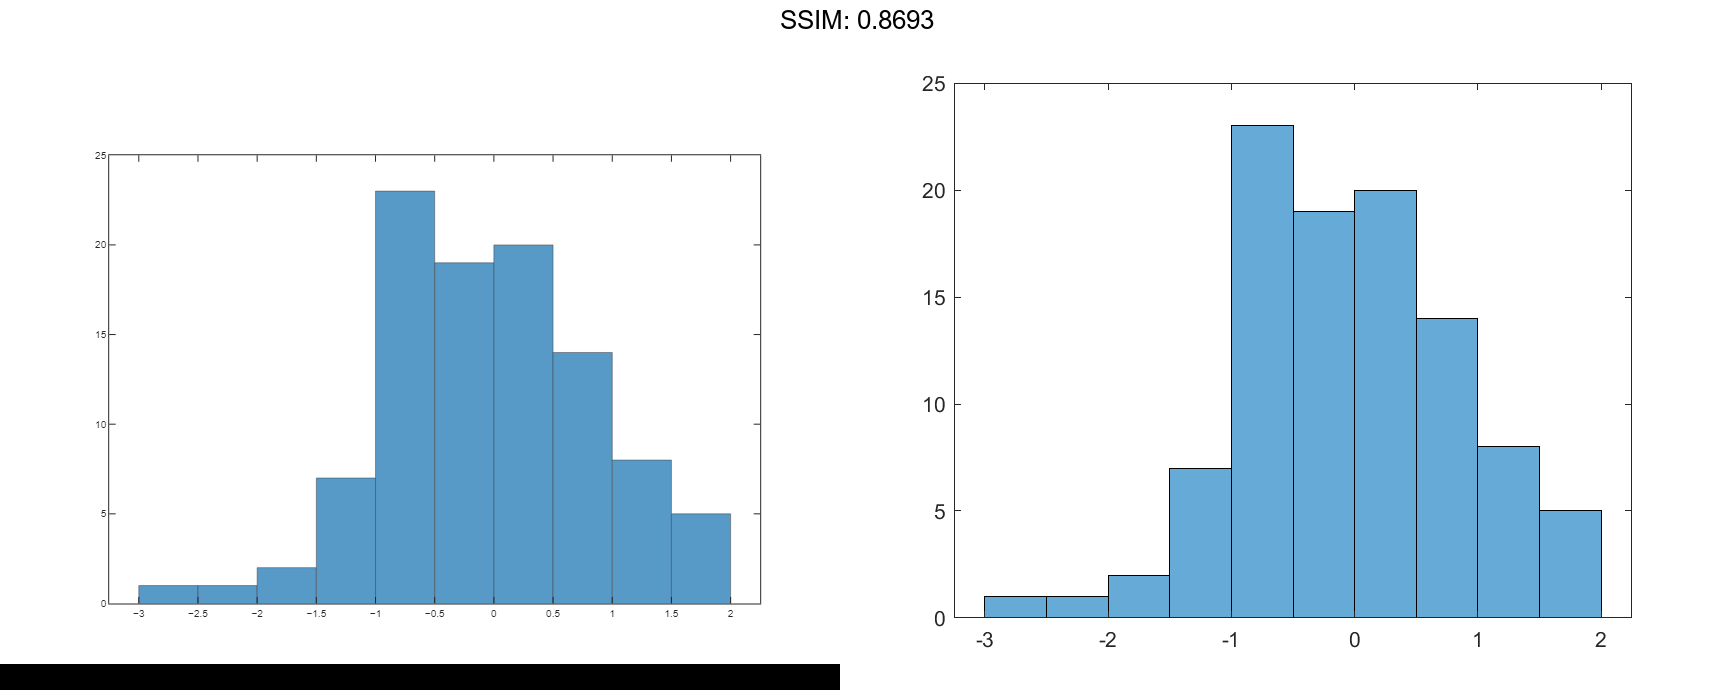
Adjust Histogram Properties
Generate 1,000 random numbers and create a histogram. Return the histogram object to adjust the properties of the histogram without recreating the entire plot.
x = randn(1000,1); h = histogram(x)
h =
  Histogram with properties:

             Data: [1000x1 double]
           Values: [1x23 double]
          NumBins: 23
         BinEdges: [1x24 double]
         BinWidth: 0.3000
        BinLimits: [-3.3000 3.6000]
    Normalization: 'count'
        FaceColor: 'auto'
        EdgeColor: [0 0 0]

  Show all properties
h.NumBins = 15;

fig2plotly()
Specify the edges of the bins with a vector. The first value in the vector is the left edge of the first bin. The last value is the right edge of the last bin.
h.BinEdges = [-3:3];

fig2plotly()
Change the color of the histogram bars.
h.FaceColor = [0 0.5 0.5];
h.EdgeColor = 'r';

fig2plotly()
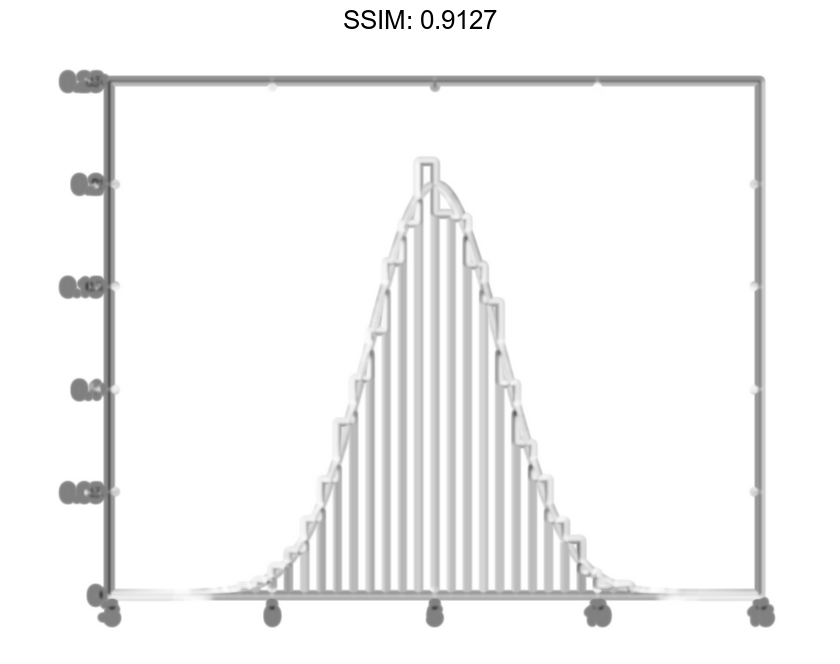
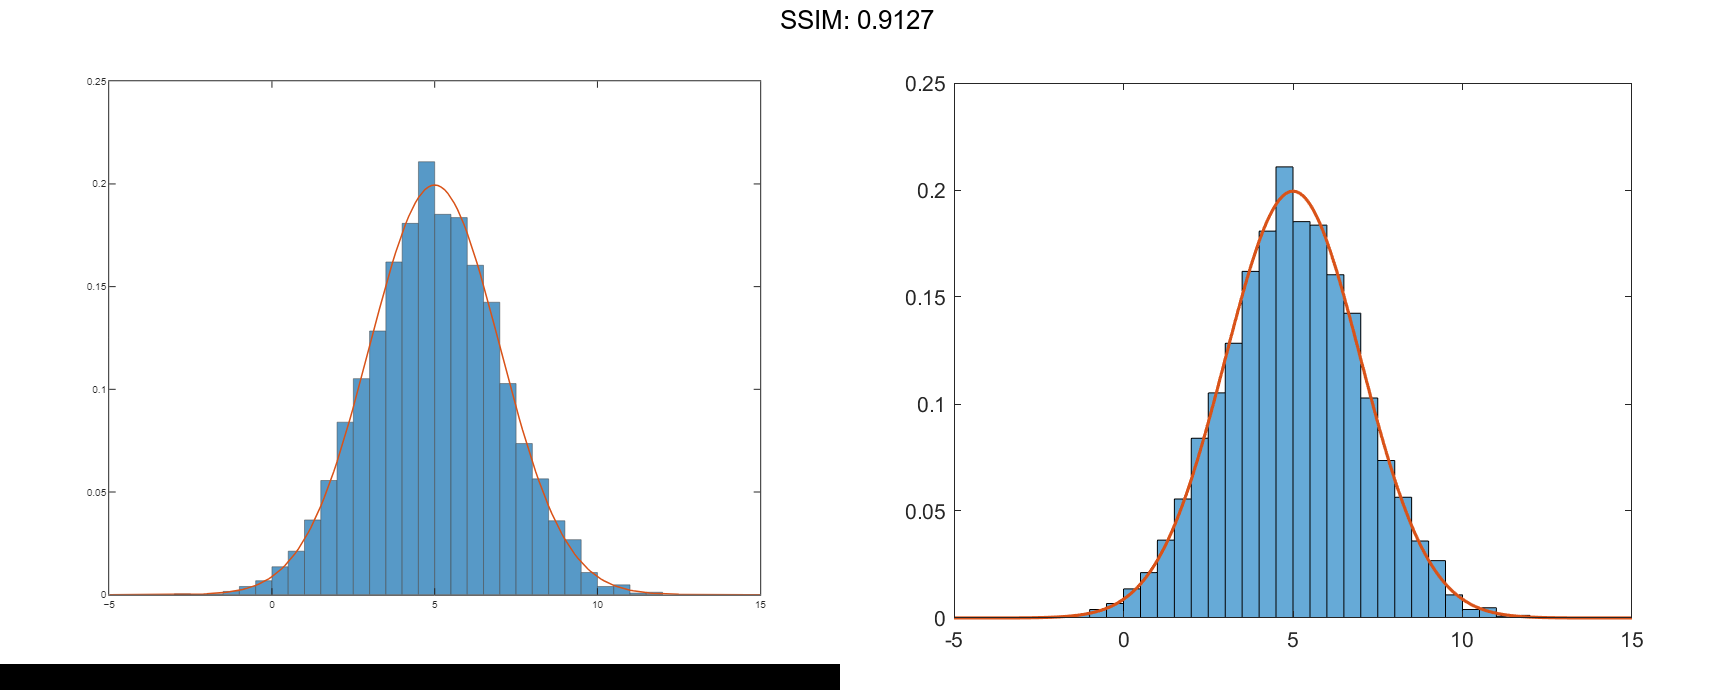
Determine Underlying Probability Distribution
Generate 5,000 normally distributed random numbers with a mean of 5 and a standard deviation of 2. Plot a histogram with Normalization set to 'pdf' to produce an estimation of the probability density function.
x = 2*randn(5000,1) + 5;
histogram(x,'Normalization','pdf')

fig2plotly()
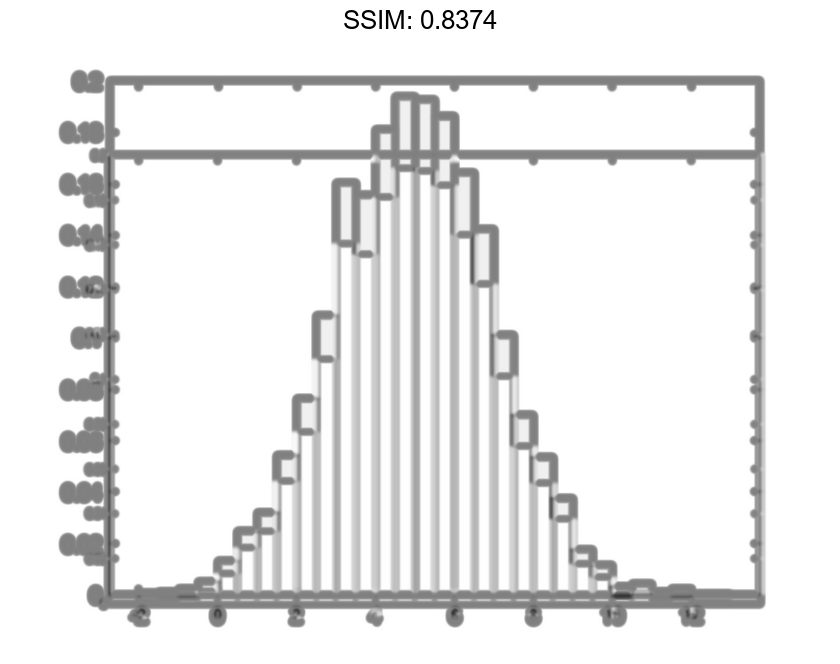
In this example, the underlying distribution for the normally distributed data is known. You can, however, use the 'pdf' histogram plot to determine the underlying probability distribution of the data by comparing it against a known probability density function.
The probability density function for a normal distribution with mean μ, standard deviation σ, and variance σ2 is
Overlay a plot of the probability density function for a normal distribution with a mean of 5 and a standard deviation of 2.
hold on
y = -5:0.1:15;
mu = 5;
sigma = 2;
f = exp(-(y-mu).^2./(2*sigma^2))./(sigma*sqrt(2*pi));
plot(y,f,'LineWidth',1.5)

fig2plotly()
Saving and Loading Histogram Objects
Use the savefig function to save a histogram figure.
histogram(randn(10));
savefig('histogram.fig');
close gcf

fig2plotly()
Use openfig to load the histogram figure back into MATLAB. openfig also returns a handle to the figure, h.
h = openfig('histogram.fig');
Use the findobj function to locate the correct object handle from the figure handle. This allows you to continue manipulating the original histogram object used to generate the figure.
y = findobj(h,'type','histogram')
y =
  Histogram with properties:

             Data: [10x10 double]
           Values: [2 17 28 32 16 3 2]
          NumBins: 7
         BinEdges: [-3 -2 -1 0 1 2 3 4]
         BinWidth: 1
        BinLimits: [-3 4]
    Normalization: 'count'
        FaceColor: 'auto'
        EdgeColor: [0 0 0]

  Show all properties