MATLAB contourslice in MATLAB®
Learn how to make 4 contourslice charts in MATLAB, then publish them to the Web with Plotly.
Draw Contours for Single Slice
Create a single slice plane through volumetric data and draw contours of the data values.
Create the matrices X, Y, Z, and V from the flow data set. Draw contours of V in the slice plane where z = 0.
[X,Y,Z,V] = flow;
zslice = 0;
contourslice(X,Y,Z,V,[],[],zslice)
grid on

fig2plotly()
Draw Contours in Slice Planes
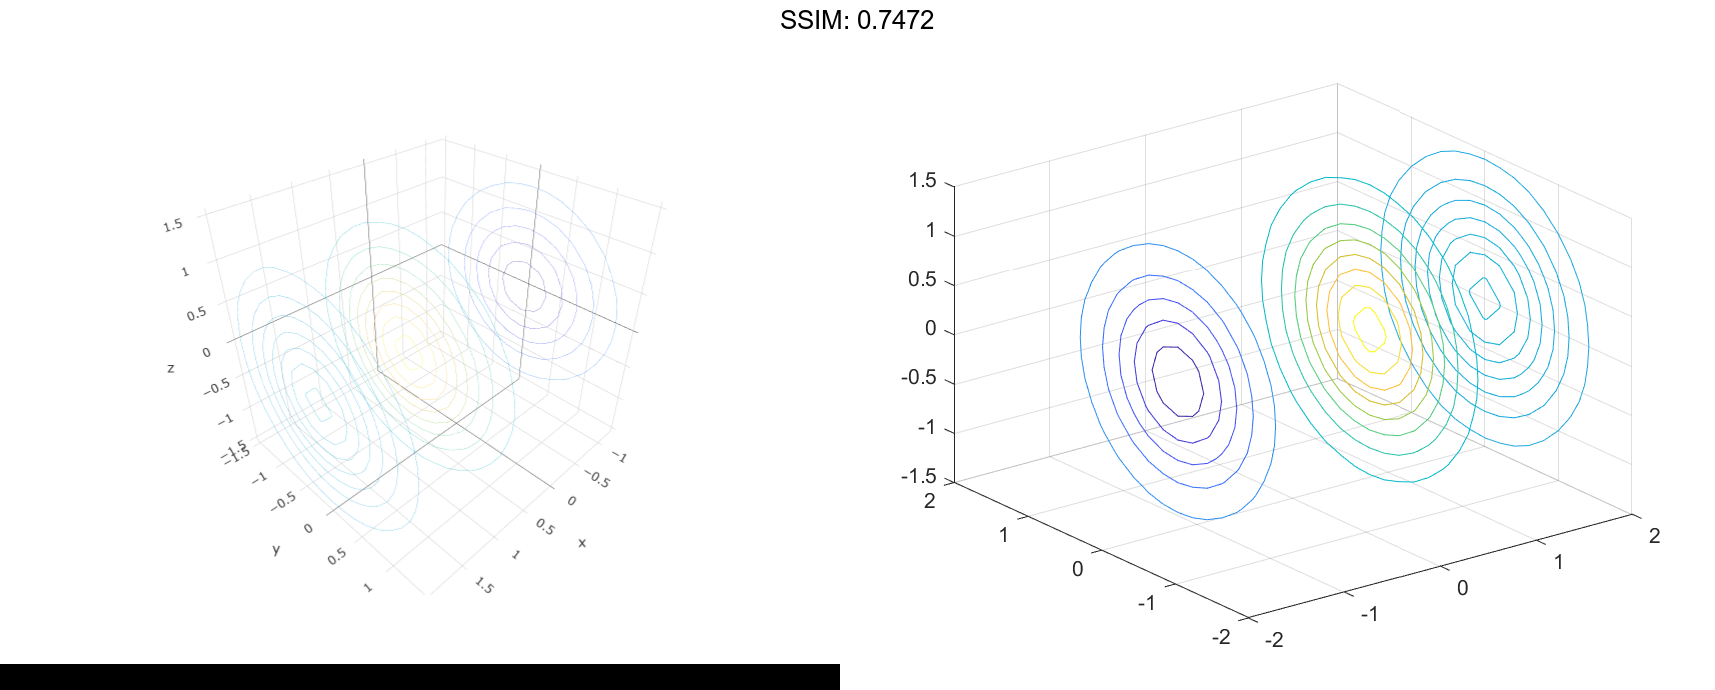
Create multiple slice planes through volumetric data. Draw contours of the data values in each of the slice planes. Let MATLAB choose the contour levels.
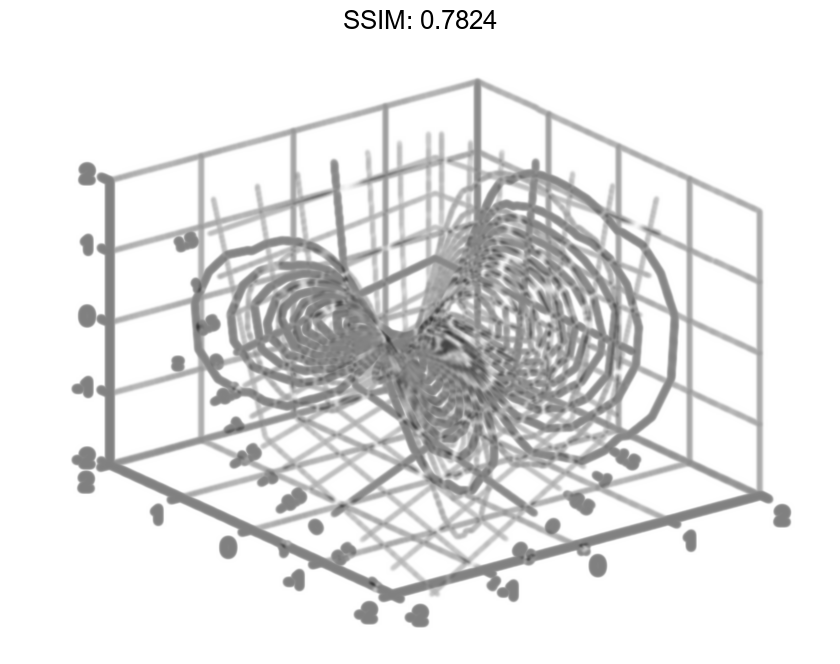
Create V as an array of volume data defined by v=xe-x2-y2-z2. Draw contours in three slice planes that are orthogonal to the x-axis at the values -1.2,0.8, and2`. Do not create any slice planes that are orthogonal to the y-axis or z-axis by specifying empty arrays. Change the axes view to a 3-D view and add grid lines.
[X,Y,Z] = meshgrid(-2:.2:2);
V = X.*exp(-X.^2-Y.^2-Z.^2);

xslice = [-1.2,0.8,2];
yslice = [];
zslice = [];
contourslice(X,Y,Z,V,xslice,yslice,zslice)
view(3)
grid on

fig2plotly()

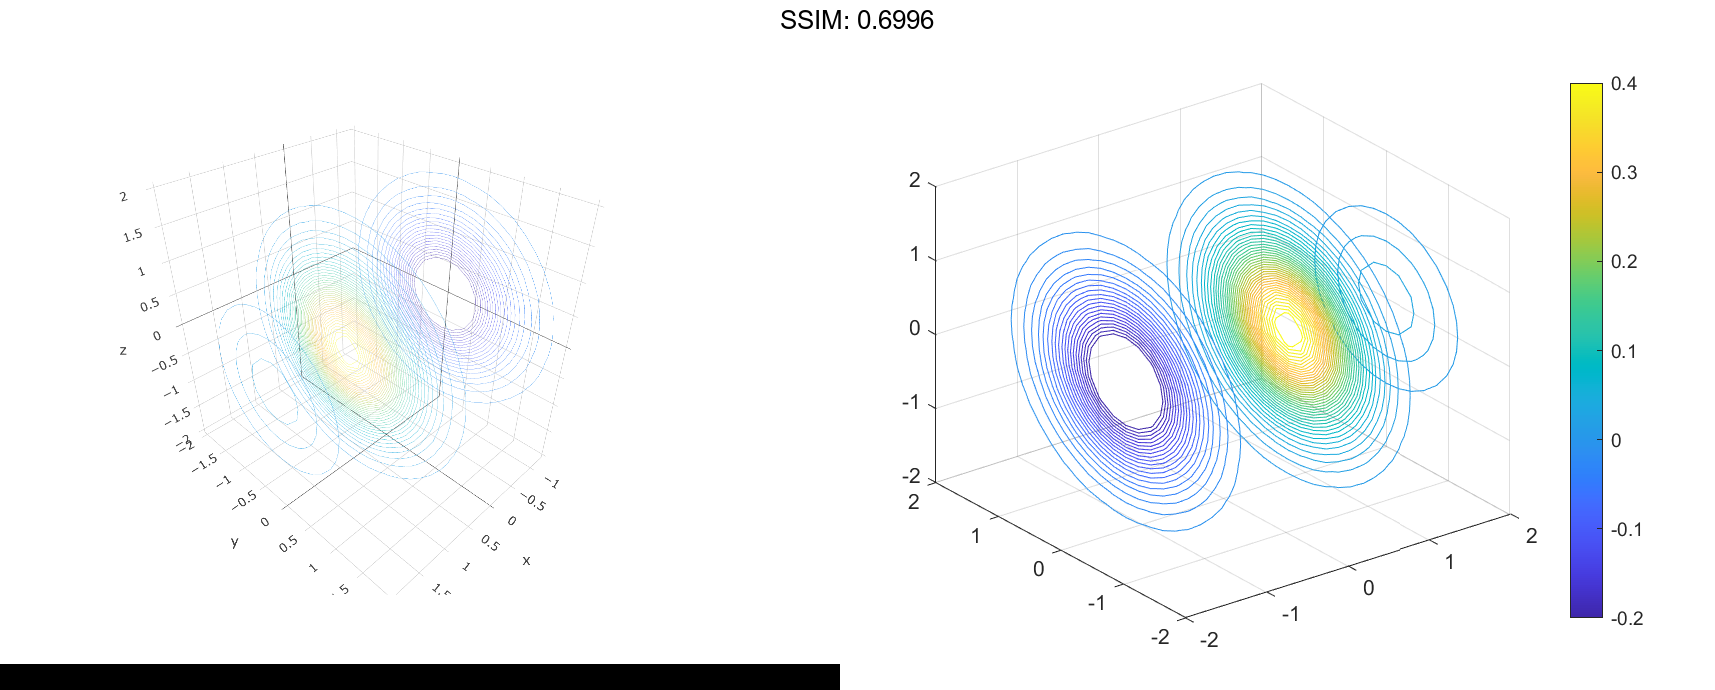
Specify Contour Levels and Add Colorbar
Create multiple slice planes through volumetric data. Draw contours of the data values in each of the slice planes. Specify the levels where you want to draw the contours. Then, add a colorbar.
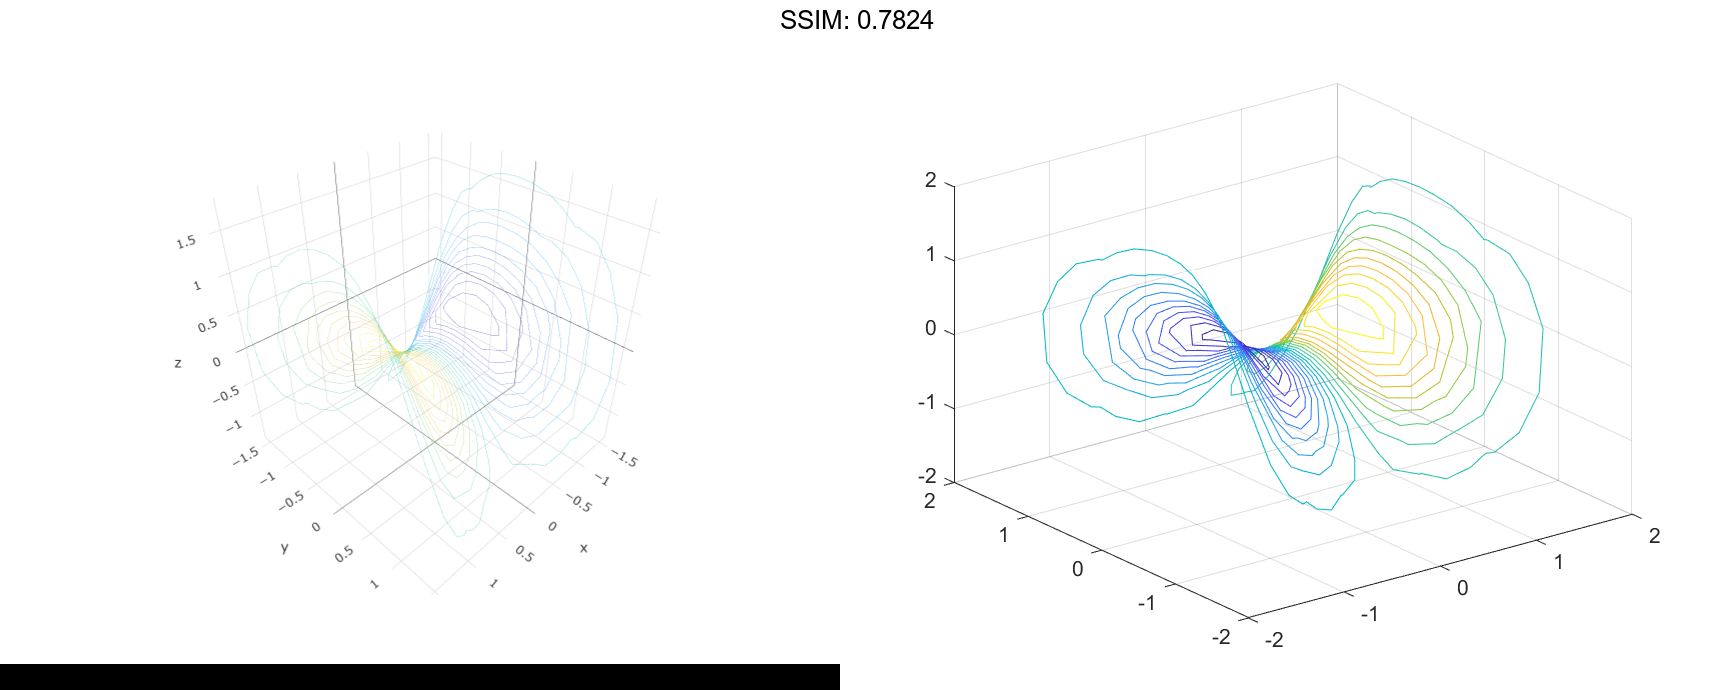
Draw contours in three slice planes that are orthogonal to the x-axis at the values -1.2,0.8, and2. Draw contours for the volume data between the values -0.2 and 0.4, spaced every 0.01. Add a colorbar to see how the data values map to the contour colors. Also, change the axes view to a 3-D view and add grid lines.
[X,Y,Z] = meshgrid(-2:.2:2);
V = X.*exp(-X.^2-Y.^2-Z.^2);
xslice = [-1.2,0.8,2];
lvls = -0.2:0.01:0.4;

contourslice(X,Y,Z,V,xslice,[],[],lvls)
colorbar
view(3)
grid on

fig2plotly()
Draw Contours Along Surface Slice
Create a surface slice through volumetric data and draw contours along the surface of the volume data. Specify the number of contour levels to draw.
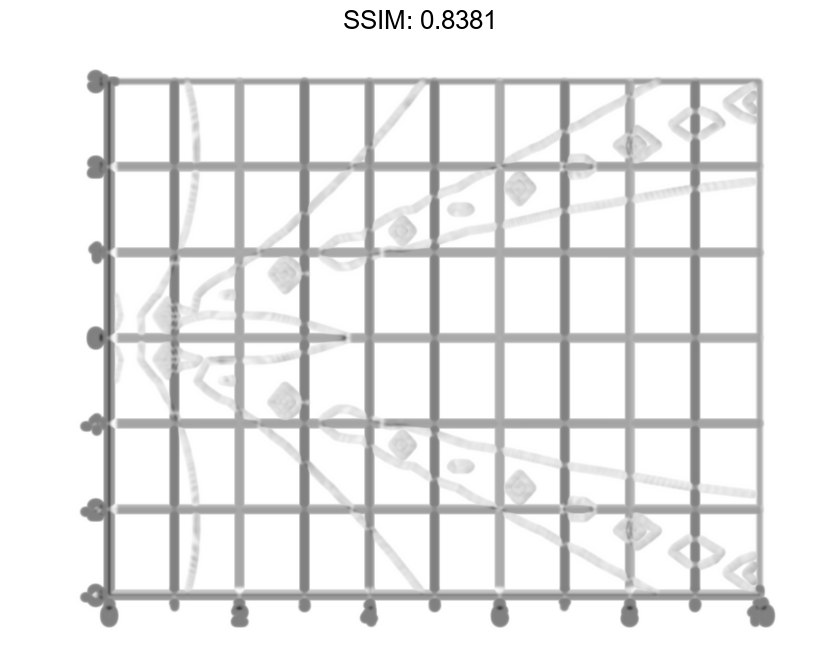
Create V as an array of volume data defined by v=xe-x2-y2-z2. Then, show a slice of the volume data along the surface defined by z=x2-y2. Draw 20 contours along the surface. Change the axes view to a 3-D view and add grid lines.
[X,Y,Z] = meshgrid(-5:0.2:5);
V = X.*exp(-X.^2-Y.^2-Z.^2);

[xsurf,ysurf] = meshgrid(-2:0.2:2);
zsurf = xsurf.^2-ysurf.^2;
contourslice(X,Y,Z,V,xsurf,ysurf,zsurf,20)
view(3)
grid on

fig2plotly()