MATLAB contour3 in MATLAB®
Learn how to make 5 contour3 charts in MATLAB, then publish them to the Web with Plotly.
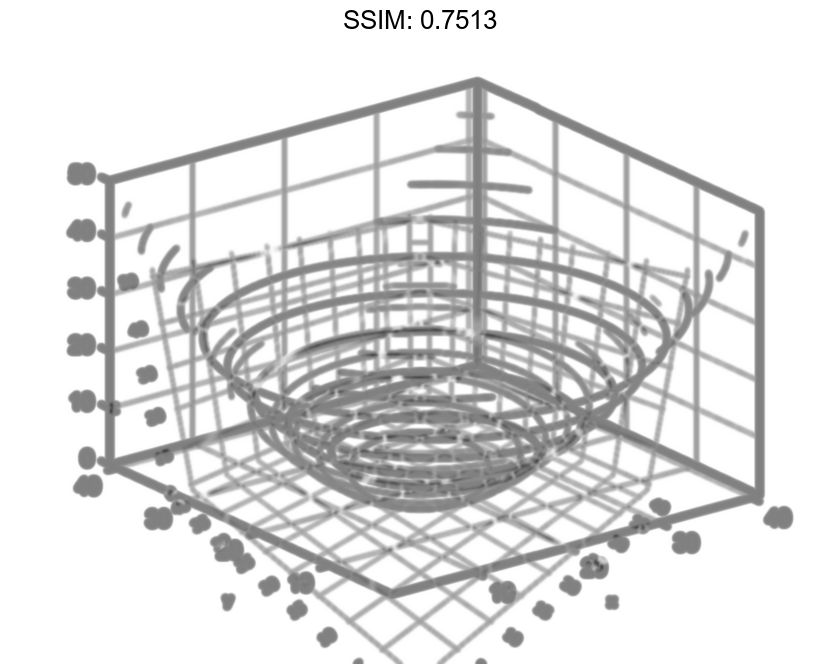
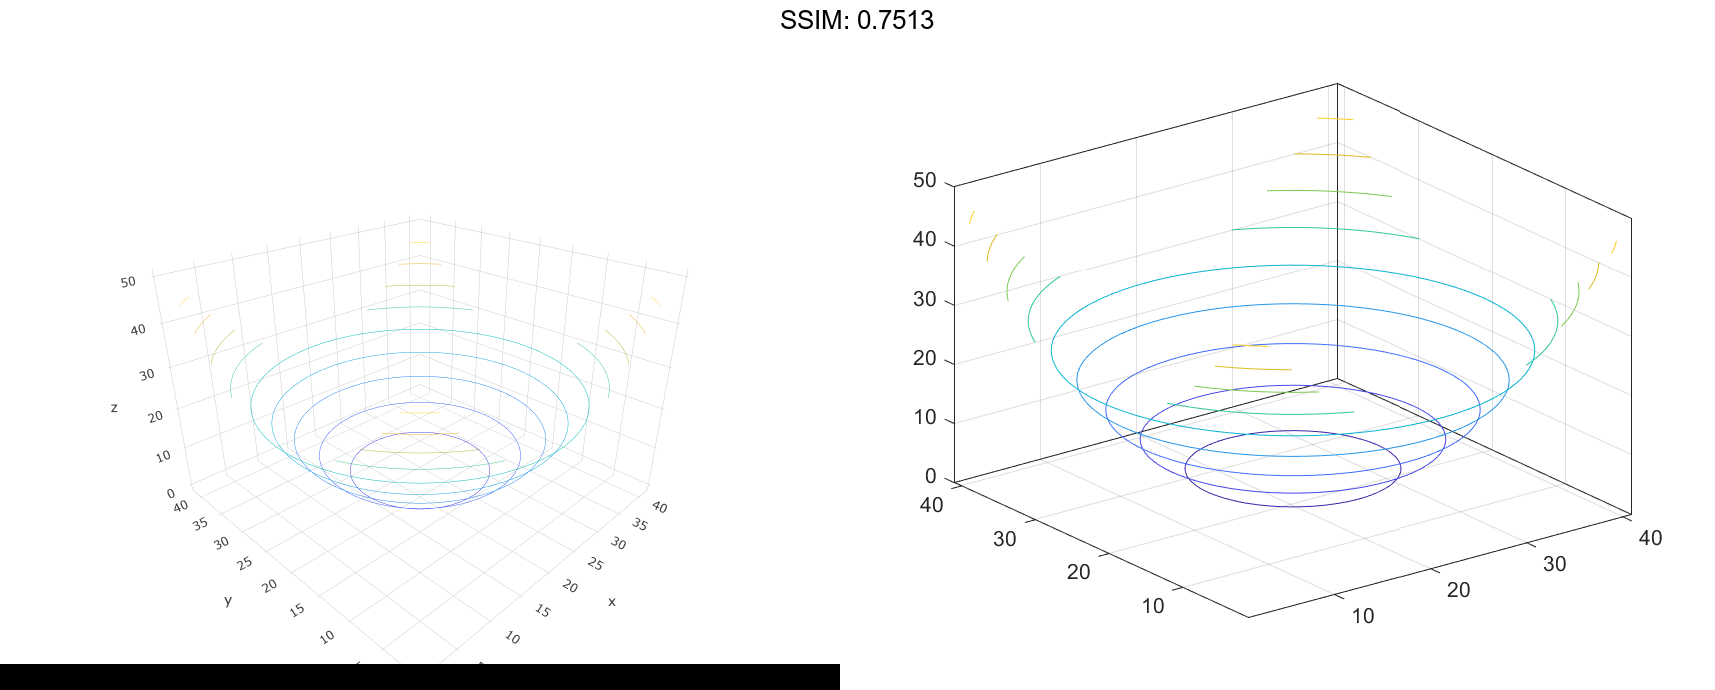
Contours of Sphere
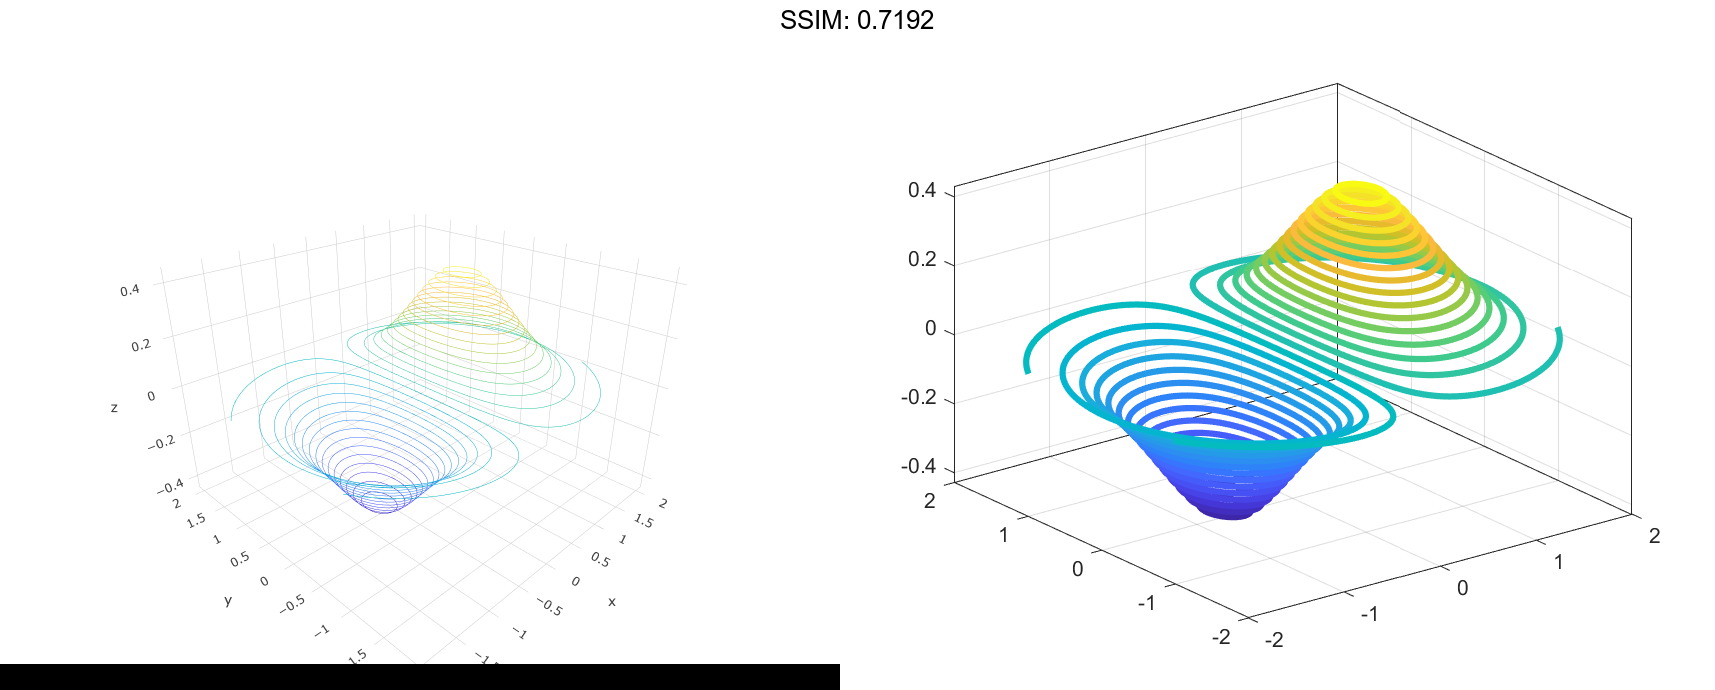
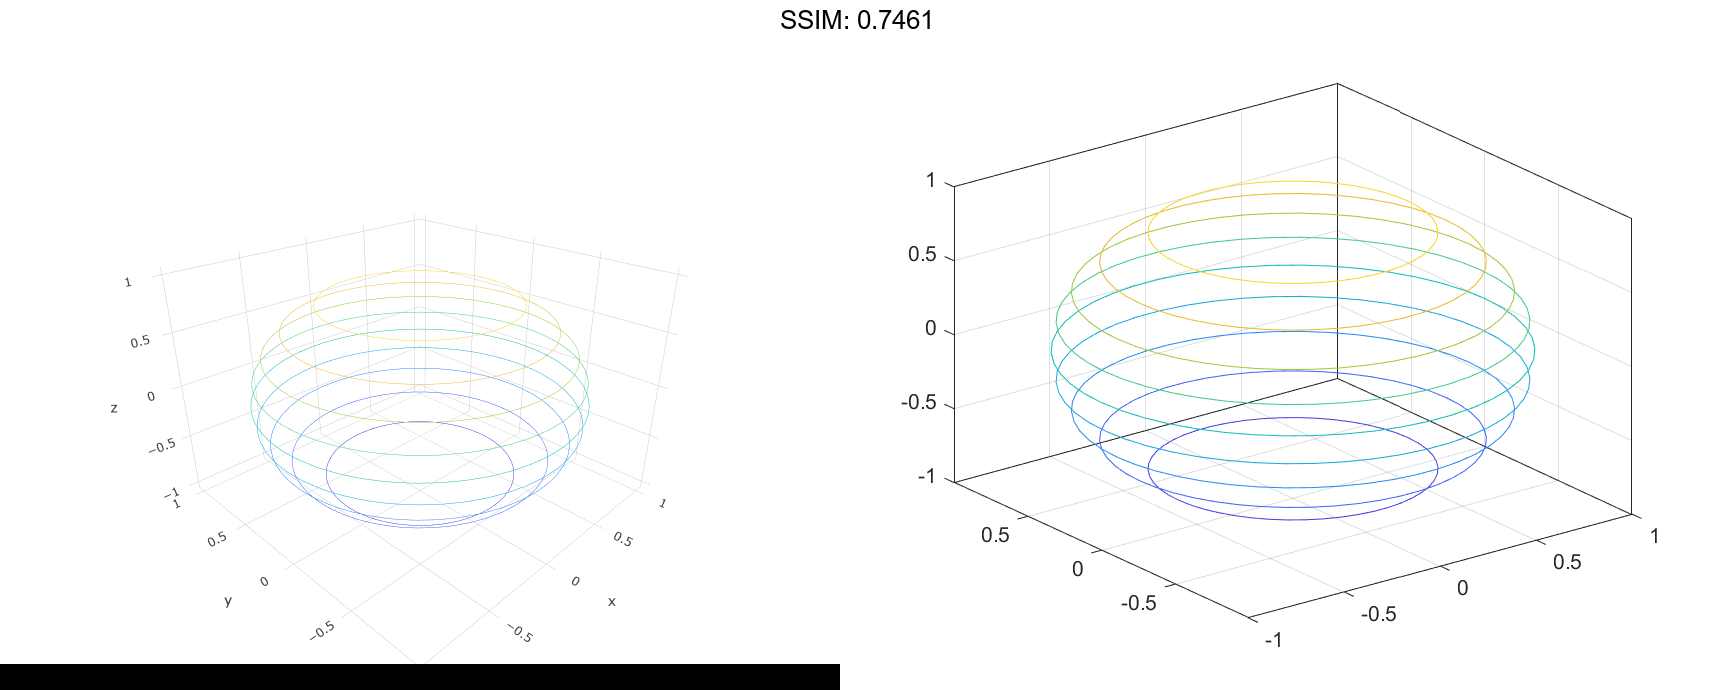
Define Z as a function of X and Y. In this case, call the sphere function to create X, Y, and Z. Then plot the contours of Z.
[X,Y,Z] = sphere(50);
contour3(X,Y,Z);

fig2plotly('TreatAs', 'contour3')
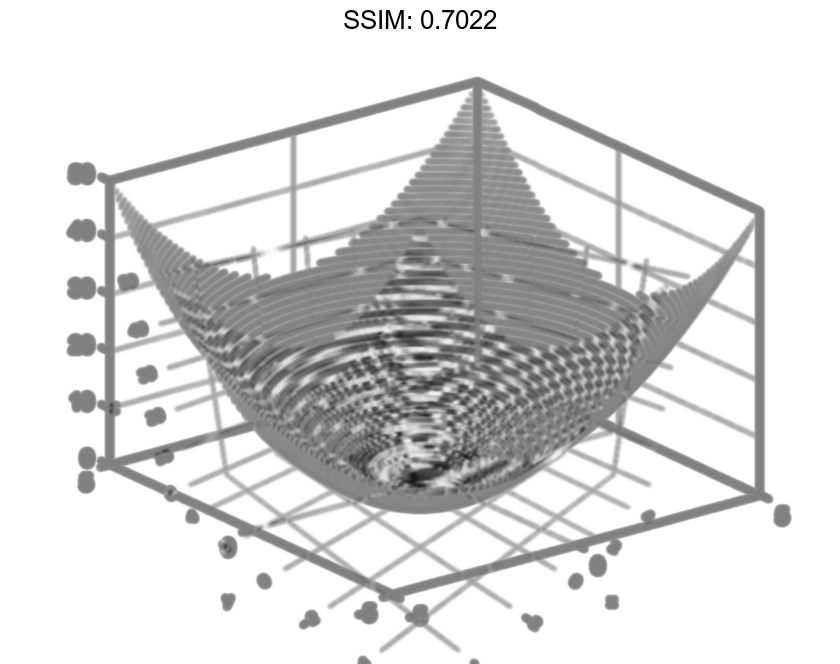
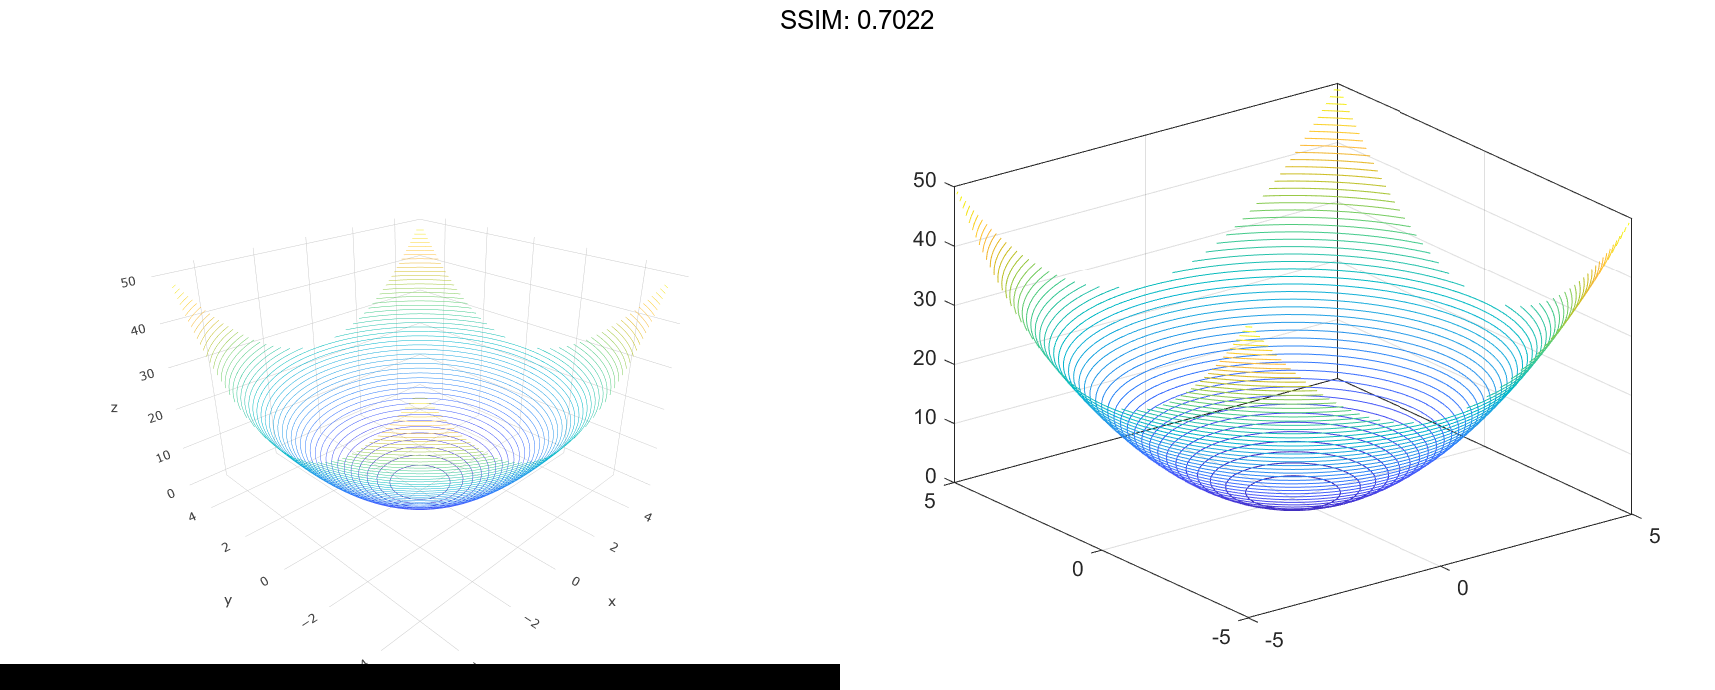
Contours at Fifty Levels
Define Z as a function of two variables, X and Y. Then plot the contours of Z. In this case, let MATLAB® choose the contours and the limits for the x- and y-axes.
[X,Y] = meshgrid(-5:0.25:5);
Z = X.^2 + Y.^2;
contour3(Z)

fig2plotly('TreatAs', 'contour3')
Now specify 50 contour levels, and display the results within the x and y limits used to calculate Z.
contour3(X,Y,Z,50)

fig2plotly('TreatAs', 'contour3')
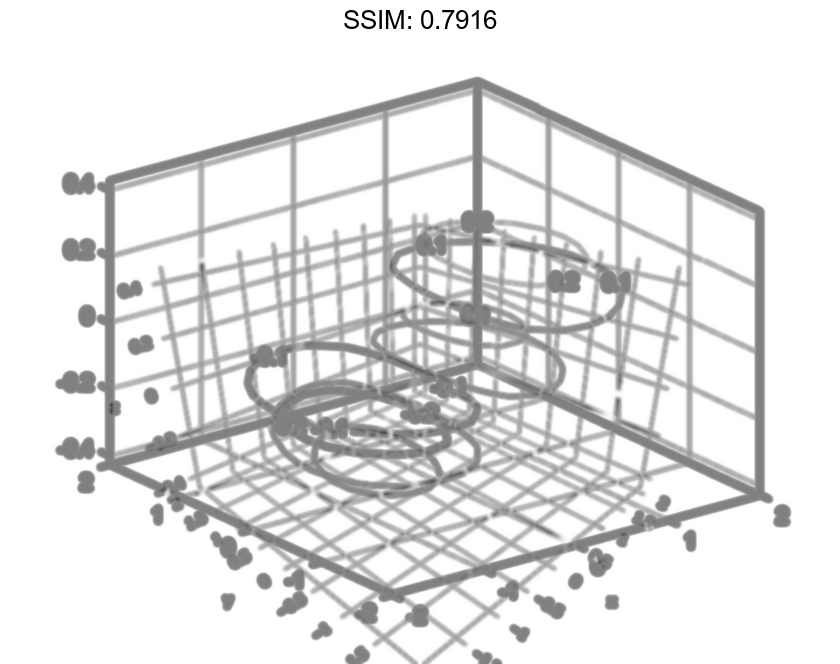
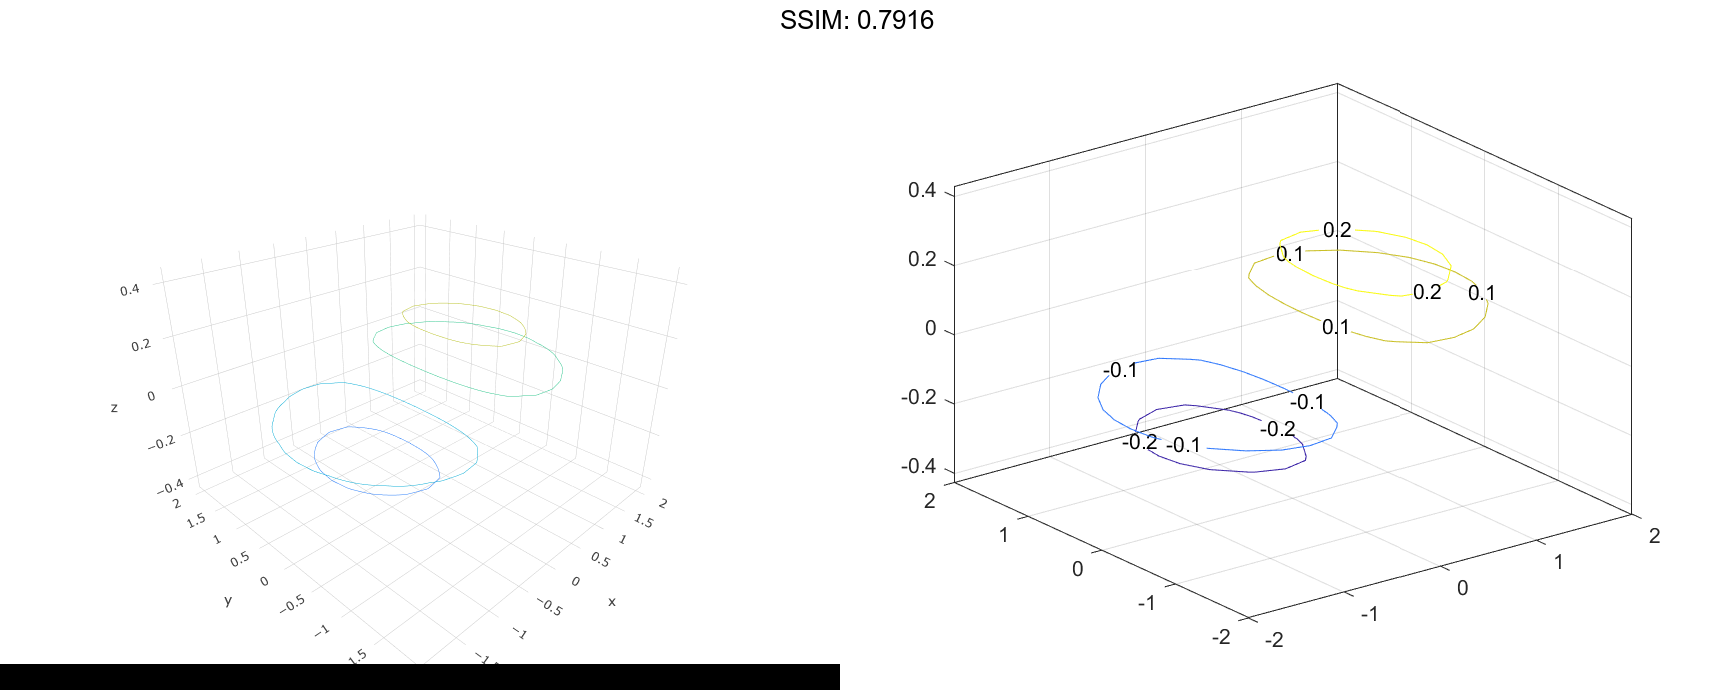
Contours at Specific Levels with Labels
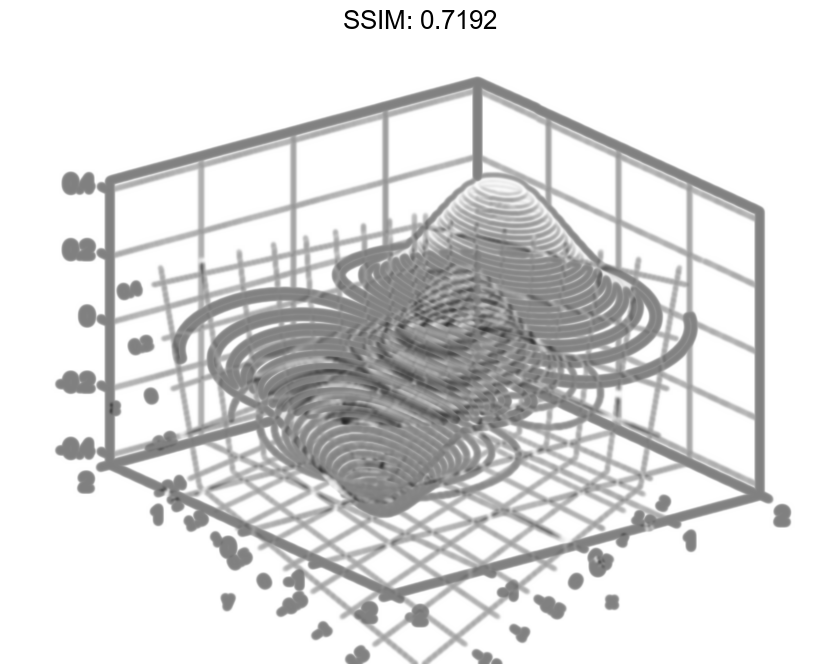
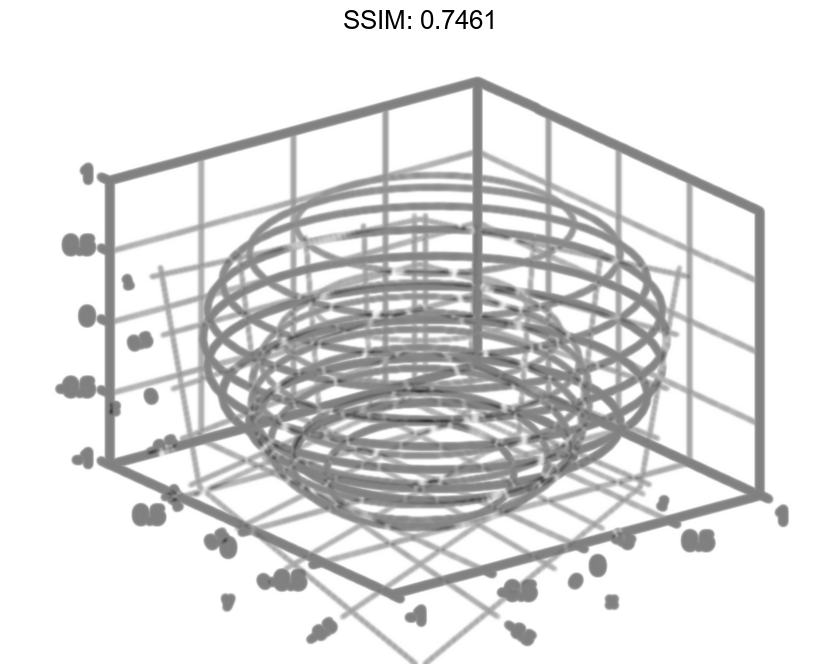
Define Z as a function of two variables, X and Y. Then plot the contours at Z = [-.2 -.1 .1 .2]. Show the contour labels by setting the ShowText property to 'on'.
[X,Y] = meshgrid(-2:0.25:2);
Z = X.*exp(-X.^2-Y.^2);
contour3(X,Y,Z,[-.2 -.1 .1 .2],'ShowText','on')

fig2plotly('TreatAs', 'contour3')
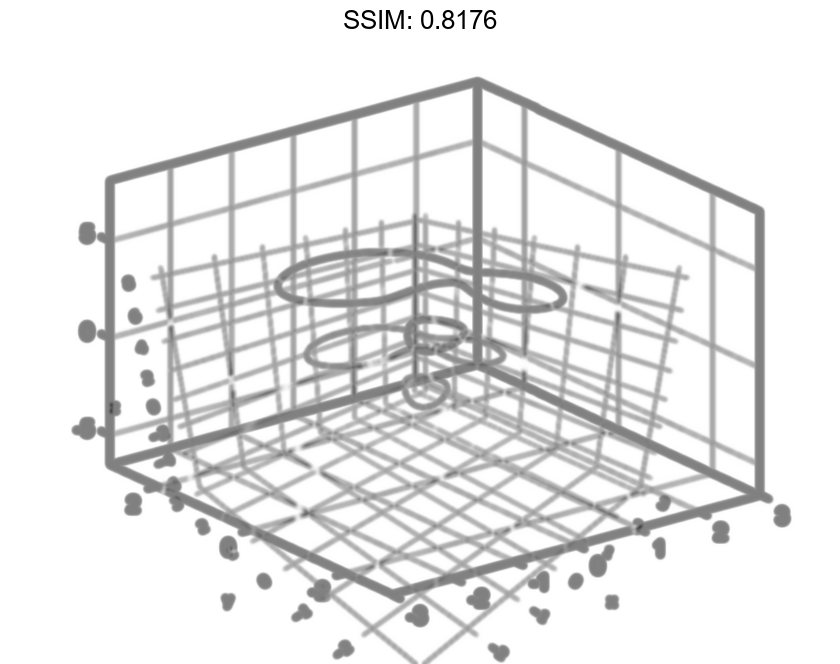
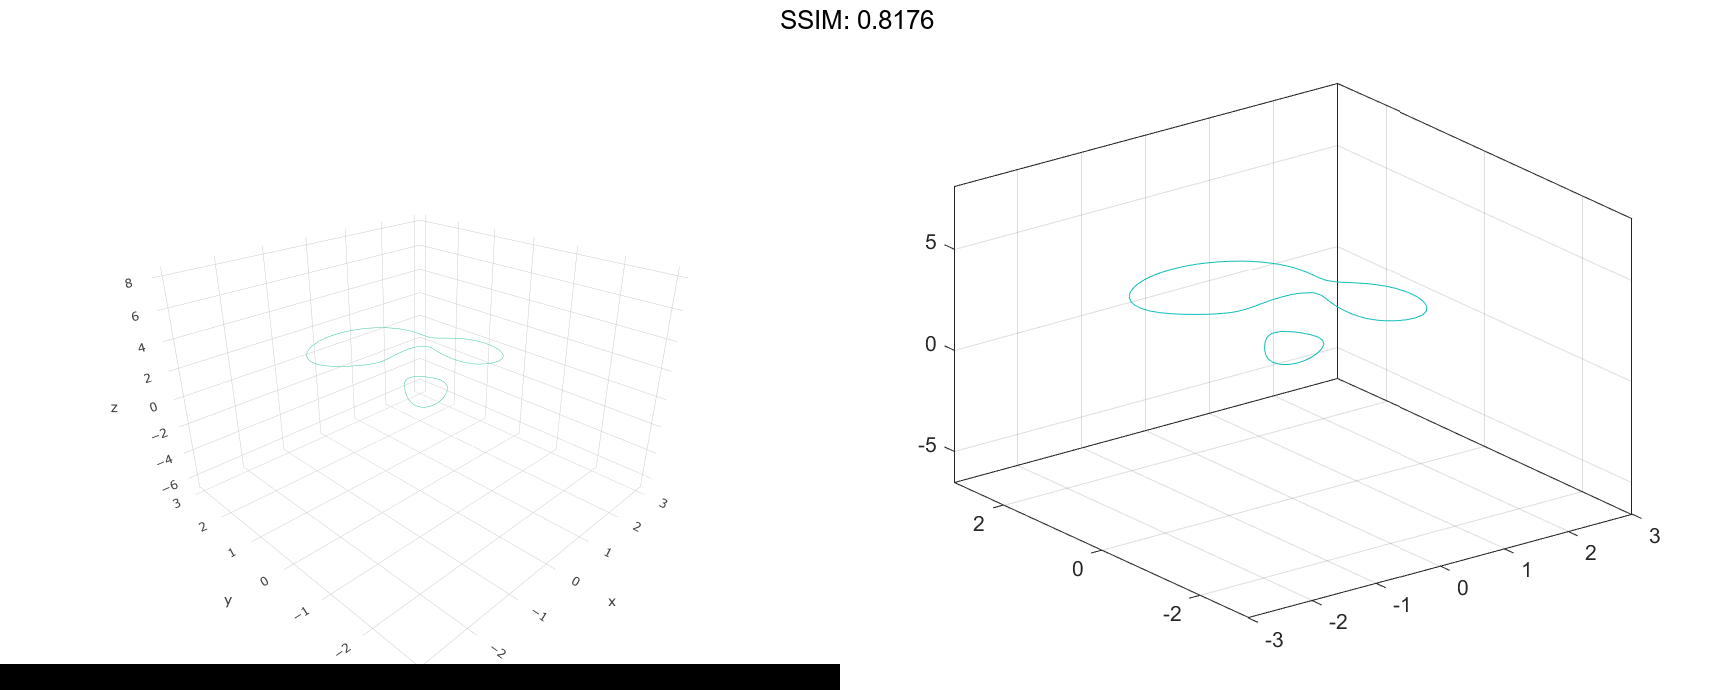
Contours at One Level
Define Z as a function of X and Y. In this case, call the peaks function to create X, Y, and Z. Then display the contours at Z = 2.
[X,Y,Z] = peaks;
contour3(X,Y,Z,[2 2]);

fig2plotly('TreatAs', 'contour3')
Custom Line Width
Define Z as a function of two variables, X and Y. Plot 30 contours of Z, and then set the line width to 3.
[X,Y] = meshgrid(-2:0.0125:2);
Z = X.*exp(-X.^2-Y.^2);
[M,c] = contour3(X,Y,Z,30);
c.LineWidth = 3;

fig2plotly('TreatAs', 'contour3')