MATLAB comet3 in MATLAB®
Learn how to make 3 comet3 charts in MATLAB, then publish them to the Web with Plotly.
Create 3-D Comet Plot
Create a comet plot of the data in z versus the data in x and y. Use the peaks function to load x, y, and z data in matrix forms. Convert the data into vector arrays. Then, plot the data.
[xmat,ymat,zmat] = peaks(100);
xvec = xmat(:);
yvec = ymat(:);
zvec = zmat(:);
comet3(xvec,yvec,zvec)

fig2plotly()


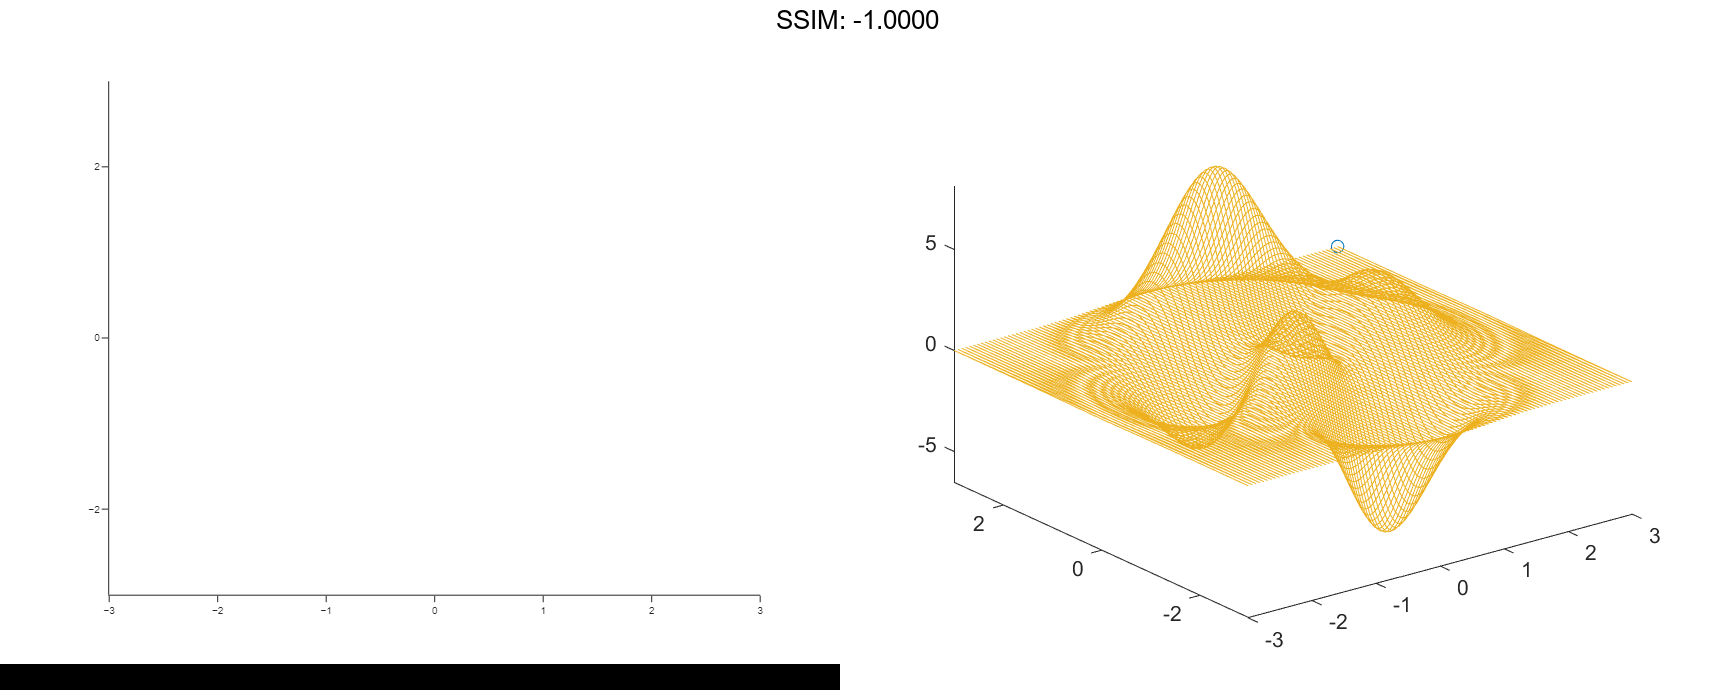
Control Comet Body Length
Create a comet plot and specify the comet body length by setting the scale factor input p. The comet body is a trailing segment in a different color that follows the head before fading.
Use the peaks function to load x, y, and z data in matrix forms. Convert the data into vector arrays. Specify p as 0.5 so that the body length is 0.5*length(y). Then, plot the data.
[xmat,ymat,zmat] = peaks(100);
xvec = xmat(:);
yvec = ymat(:);
zvec = zmat(:);
p = 0.5;
comet3(xvec,yvec,zvec,p)

fig2plotly()

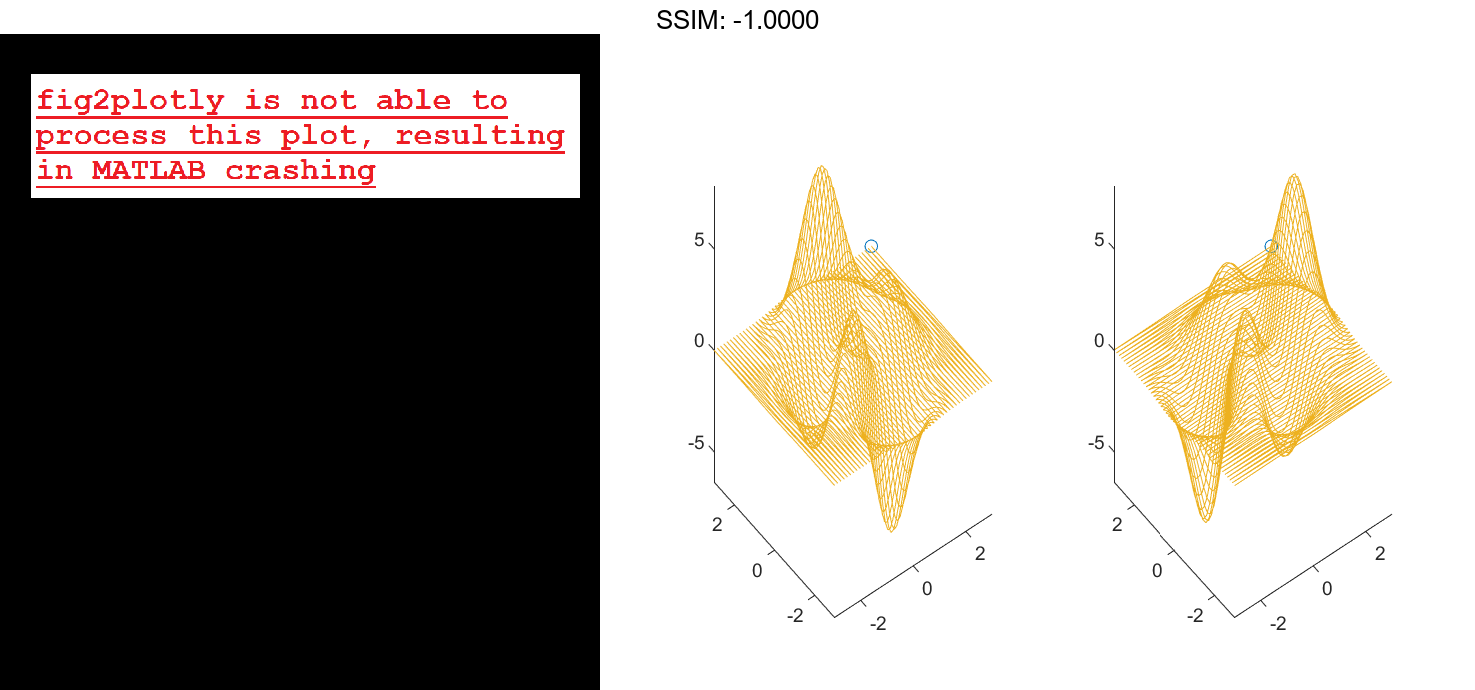
Plot Data in Specified Axes
Create two comet plots in a tiled chart layout by specifying the target axes for each plot.
Use the peaks function to load x, y, and z data in matrix forms. Convert the data into vector arrays. Specify the body length scale factor p as 0.25 so that the body length is 0.5*length(y).
[xmat,ymat,zmat] = peaks(50); xvec = xmat(:); yvec = ymat(:); zvec = zmat(:); p = 0.25;
Store the two Axes objects as ax1 and ax2. Specify the target axes for each comet plot by including the Axes object as the first input argument to comet.
tiledlayout(1,2);
ax1 = nexttile;
ax2 = nexttile;

comet3(ax1,xvec,yvec,zvec,p)
comet3(ax2,yvec,xvec,zvec,p)

fig2plotly()