

3D Mathematical Expressions and Functions Plots in MATLAB®
How to make xxx plots in MATLAB® with Plotly.
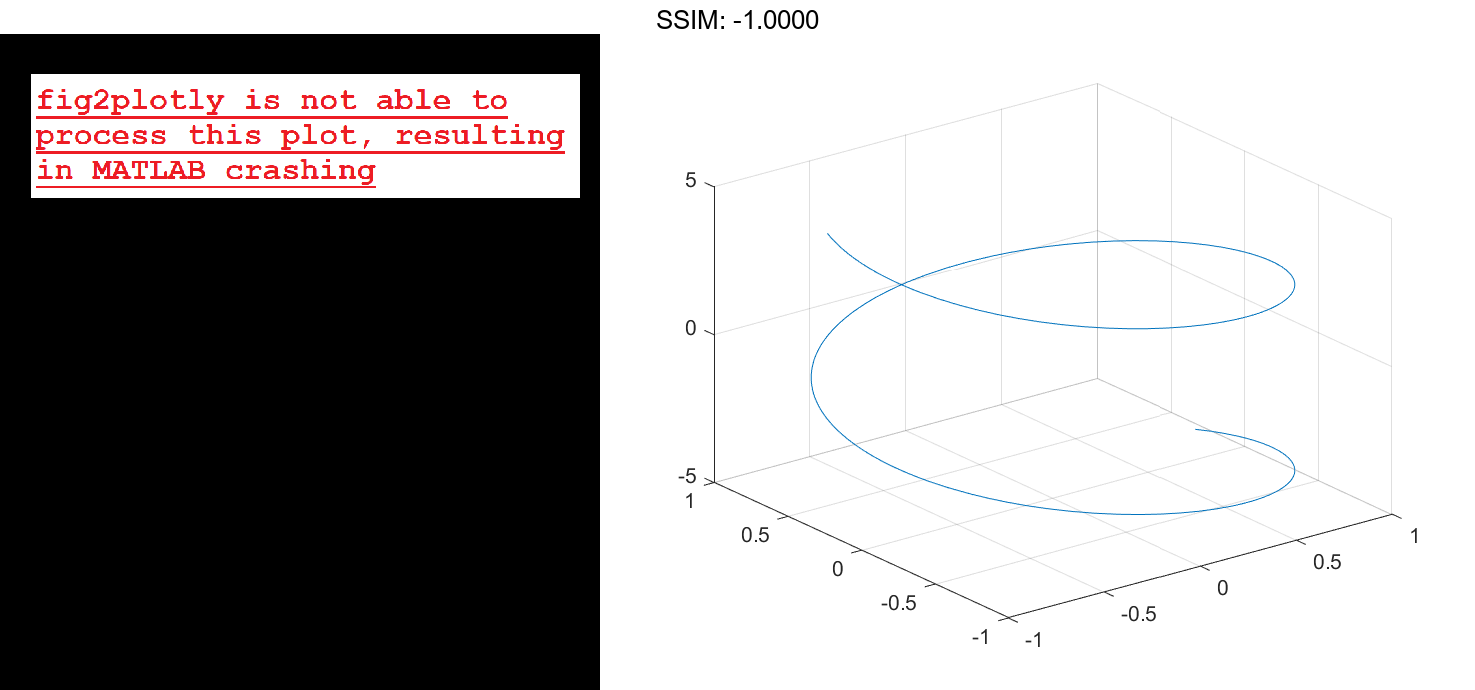
Plot 3-D Parametric Line
Plot the 3-D parametric line
x=sin(t)
y=cos(t)
z=t
over the default parameter range [-5 5].
xt = @(t) sin(t);
yt = @(t) cos(t);
zt = @(t) t;
fplot3(xt,yt,zt)

fig2plotly()


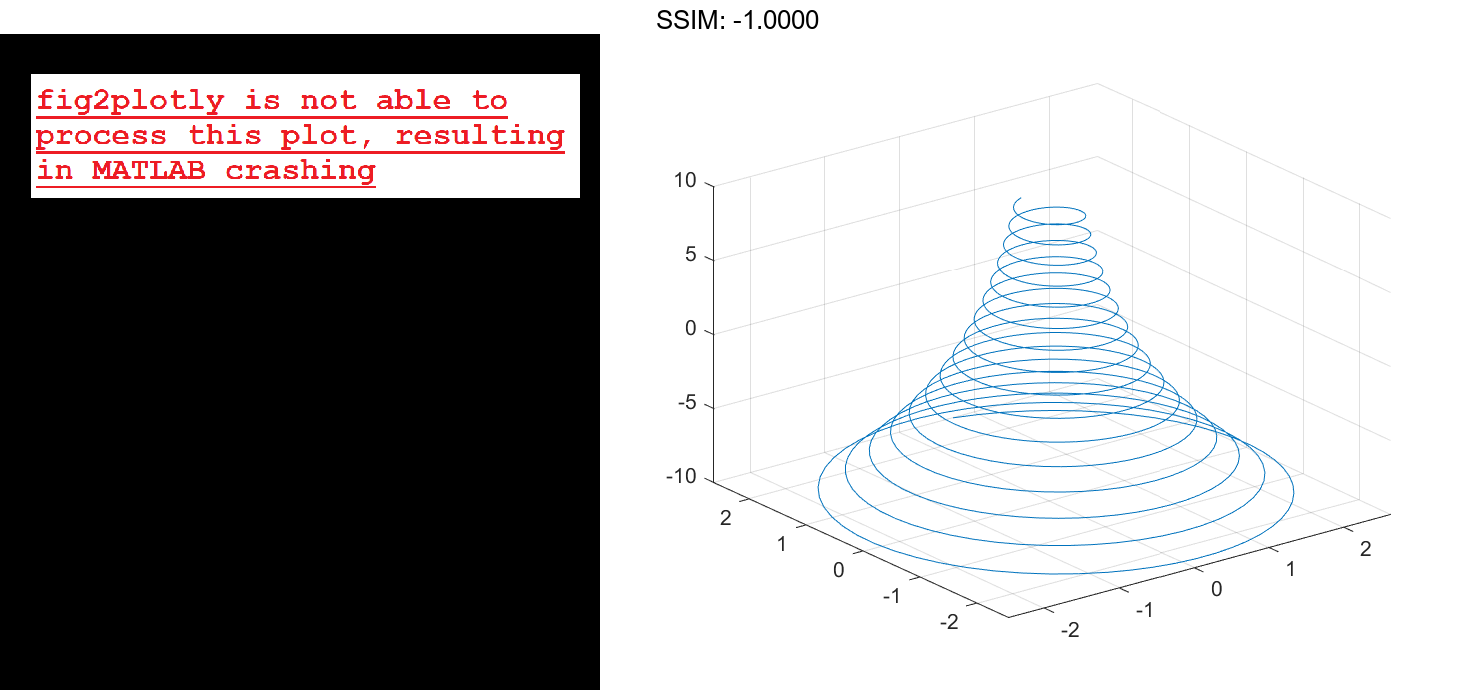
Specify Parameter Range
Plot the parametric line
x=e-t/10sin(5t)
y=e-t/10cos(5t)
z=t
over the parameter range [-10 10] by specifying the fourth input argument of fplot3.
xt = @(t) exp(-t/10).*sin(5*t);
yt = @(t) exp(-t/10).*cos(5*t);
zt = @(t) t;
fplot3(xt,yt,zt,[-10 10])

fig2plotly()

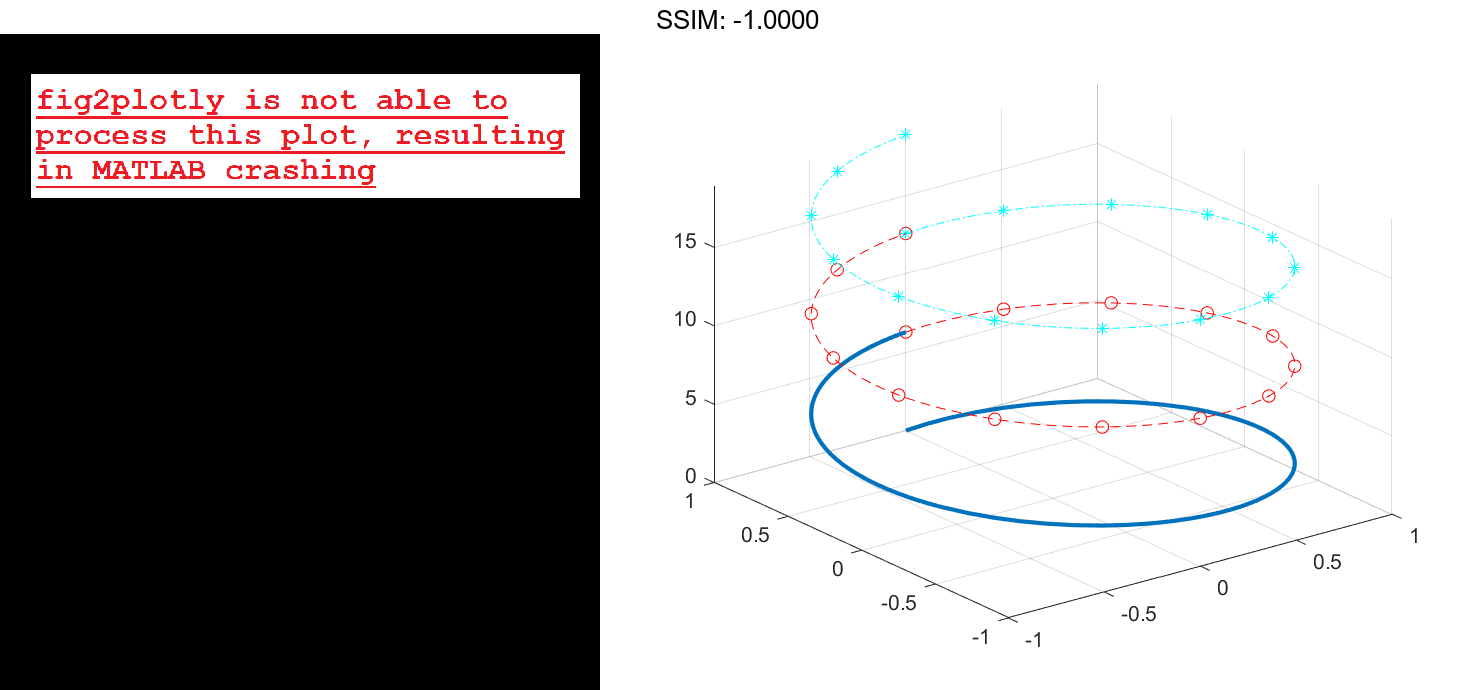
Specify Line Properties and Display Markers
Plot the same 3-D parametric curve three times over different intervals of the parameter. For the first interval, use a line width of 2 points. For the second, specify a dashed red line style with circle markers. For the third, specify a cyan, dash-dotted line style with asterisk markers.
fplot3(@(t)sin(t), @(t)cos(t), @(t)t, [0 2*pi], 'LineWidth', 2)
hold on
fplot3(@(t)sin(t), @(t)cos(t), @(t)t, [2*pi 4*pi], '--or')
fplot3(@(t)sin(t), @(t)cos(t), @(t)t, [4*pi 6*pi], '-.*c')
hold off

fig2plotly()

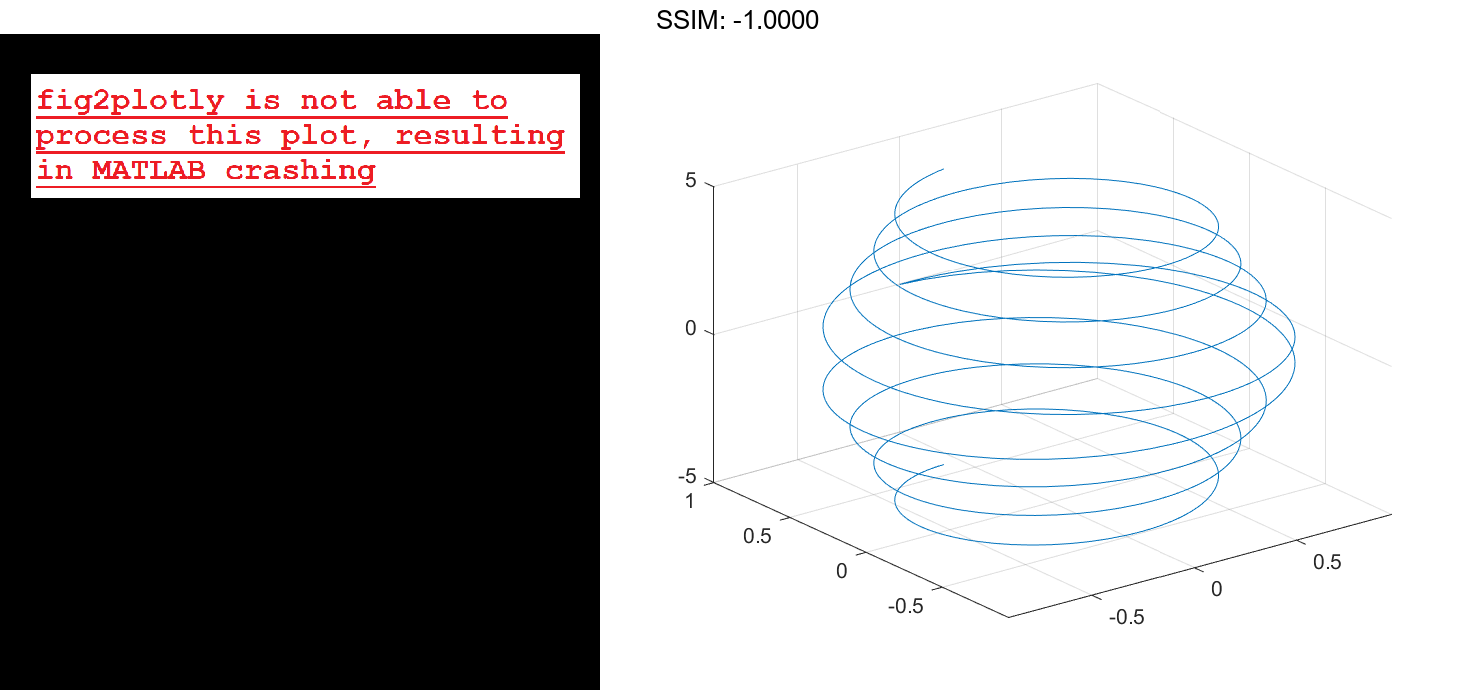
Plot Multiple Lines in Same Axes
Plot multiple lines in the same axes using hold on.
fplot3(@(t)t, @(t)t, @(t)t)
hold on
fplot3(@(t)-t, @(t)t, @(t)-t)
hold off

fig2plotly()


Modify 3-D Parametric Line After Creation
Plot the parametric line
x=e-|t|/10sin(5|t|)
y=e-|t|/10cos(5|t|)
z=t.
Assign the parameterized function line object to a variable.
xt = @(t)exp(-abs(t)/10).*sin(5*abs(t));
yt = @(t)exp(-abs(t)/10).*cos(5*abs(t));
zt = @(t)t;
fp = fplot3(xt,yt,zt)

fig2plotly()

fp =
  ParameterizedFunctionLine with properties:

    XFunction: @(t)exp(-abs(t)/10).*sin(5*abs(t))
    YFunction: @(t)exp(-abs(t)/10).*cos(5*abs(t))
    ZFunction: @(t)t
        Color: [0 0.4470 0.7410]
    LineStyle: '-'
    LineWidth: 0.5000

  Show all properties
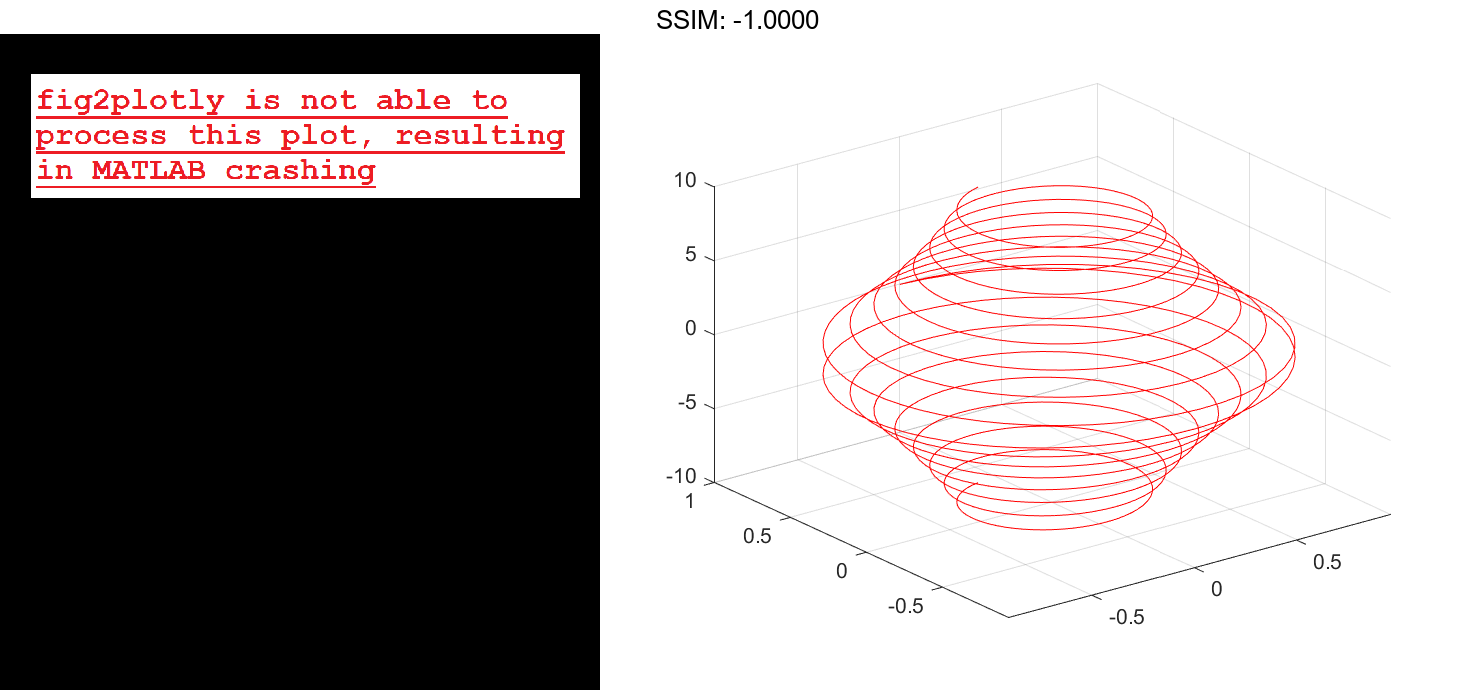
Change the range of parameter values to [-10 10] and change the line color to red.
fp.TRange = [-10 10];
fp.Color = 'r';

fig2plotly()

Add Title and Axis Labels and Format Ticks
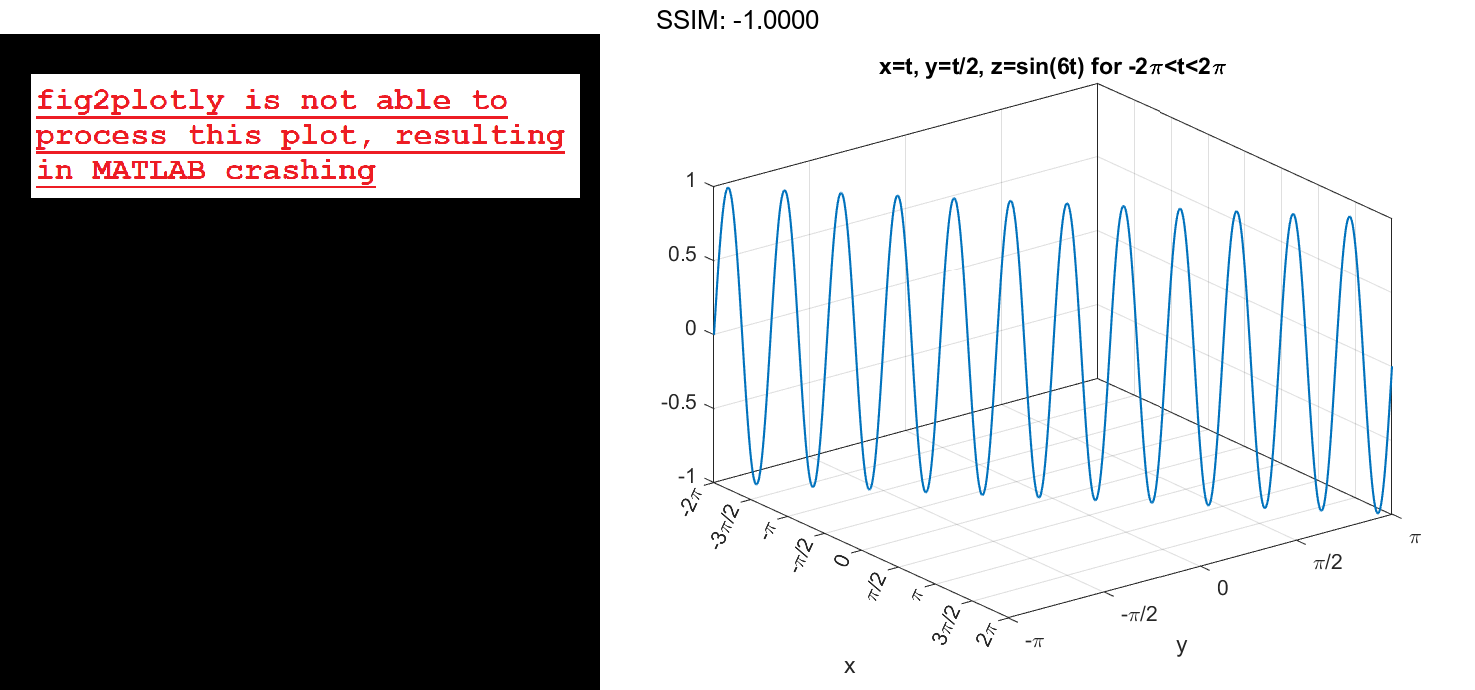
For t values in the range -2π to 2π, plot the parametric line
x=t
y=t/2
z=sin(6t).
Add a title, x-axis label, and y-axis label. Additionally, change the view of the axes and display the axes box outline.
xt = @(t)t;
yt = @(t)t/2;
zt = @(t)sin(6*t);
fplot3(xt,yt,zt,[-2*pi 2*pi],'MeshDensity',30,'LineWidth',1);
title('x=t, y=t/2, z=sin(6t) for -2\pi


Access the axes object using gca. Specify the x-axis tick values and associated labels using the XTick and XTickLabel properties of the axes object. Similarly, specify the y-axis tick values and associated labels.
ax = gca;
ax.XTick = -2*pi:pi/2:2*pi;
ax.XTickLabel = {'-2\pi','-3\pi/2','-\pi','-\pi/2','0','\pi/2','\pi','3\pi/2','2\pi'};
ax.YTick = -pi:pi/2:pi;
ax.YTickLabel = {'-\pi','-\pi/2','0','\pi/2','\pi'};
fig2plotly()

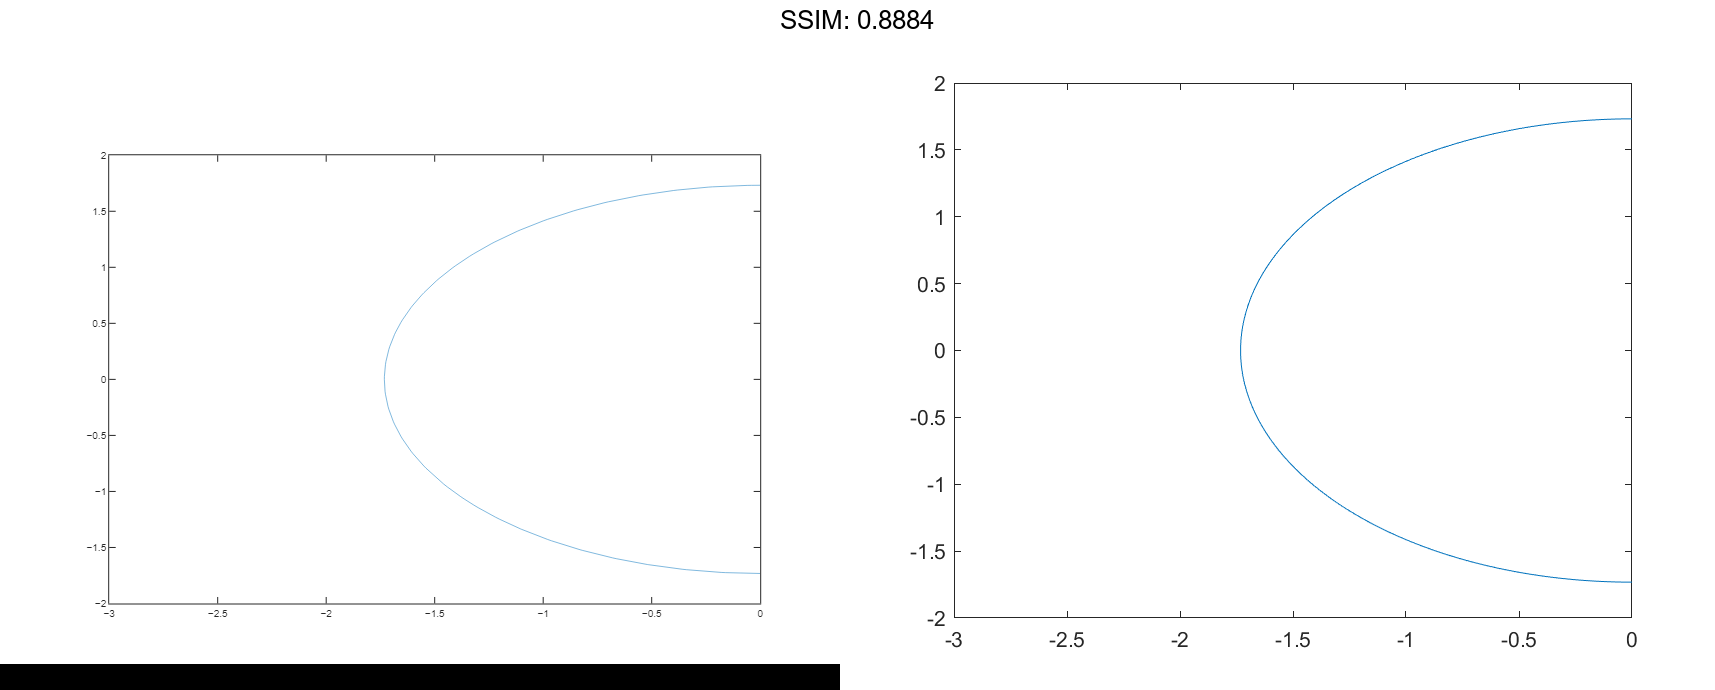
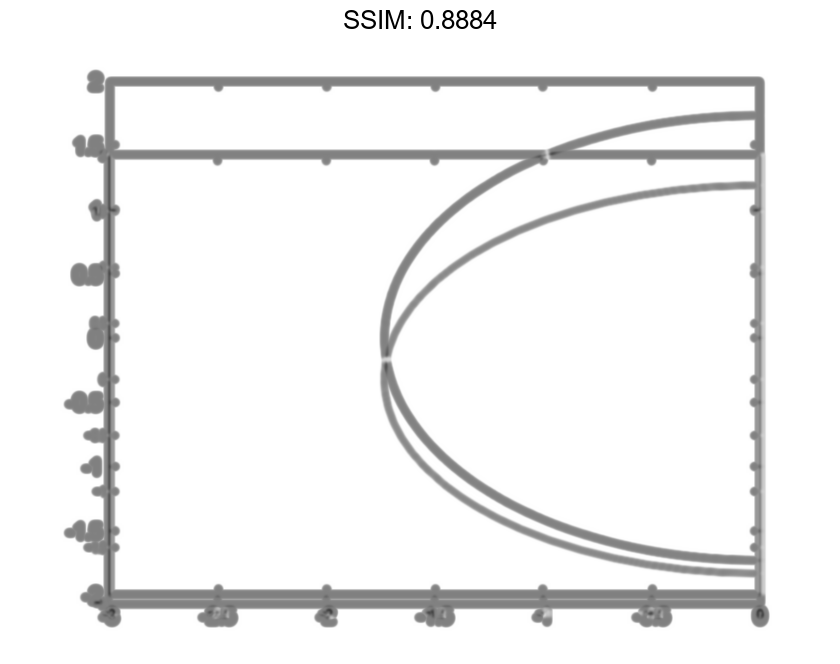
Plot 3-D Implicit Function
Plot the hyperboloid x2+y2-z2=0 over the default interval of [-5,5] for x, y, and z.
f = @(x,y,z) x.^2 + y.^2 - z.^2;
fimplicit3(f)
fig2plotly()
plot00plot3dimplicit_function
Specify Plotting Interval
Plot the upper half of the hyperboloid x2+y2-z2=0 by specifying the plotting interval as [0 5] for z. For x and y, use the default interval [-5 5].
f = @(x,y,z) x.^2 + y.^2 - z.^2;
interval = [-5 5 -5 5 0 5];
fimplicit3(f,interval)
fig2plotly()
Modify Appearance of Implicit Surface
Plot the implicit surface x2+y2-z2=0. Remove the lines by setting the EdgeColor property to 'none'. Add transparency by setting the FaceAlpha property to a value between 0 and 1.
f = @(x,y,z) x.^2 + y.^2 - z.^2;
fimplicit3(f,'EdgeColor','none','FaceAlpha',.5)
fig2plotly()
plot20modifyappearanceofimplicit_surface
Modify Implicit Surface After Creation
Plot an implicit surface and assign the implicit surface object to the variable fs.
f = @(x,y,z) 1./x.^2 - 1./y.^2 + 1./z.^2;
fs = fimplicit3(f)
fig2plotly()
plot30modifyimplicitsurfaceafter_creation
fs =
ImplicitFunctionSurface with properties:
Function: @(x,y,z)1./x.^2-1./y.^2+1./z.^2
EdgeColor: [0 0 0]
LineStyle: '-'
FaceColor: 'interp'
Show all properties
Use fs to access and modify properties of the implicit surface after it is created. For example, show only the positive x values by setting the XRange property to [0 5]. Remove the lines by setting the EdgeColor property to 'none'. Add transparency by setting the FaceAlpha property to 0.8.
fs.XRange = [0 5];
fs.EdgeColor = 'none';
fs.FaceAlpha = 0.8;
fig2plotly()
plot31modifyimplicitsurfaceafter_creation