GGPLOT - geom_tile
Creates rectangles and then convert them with ggplotly.
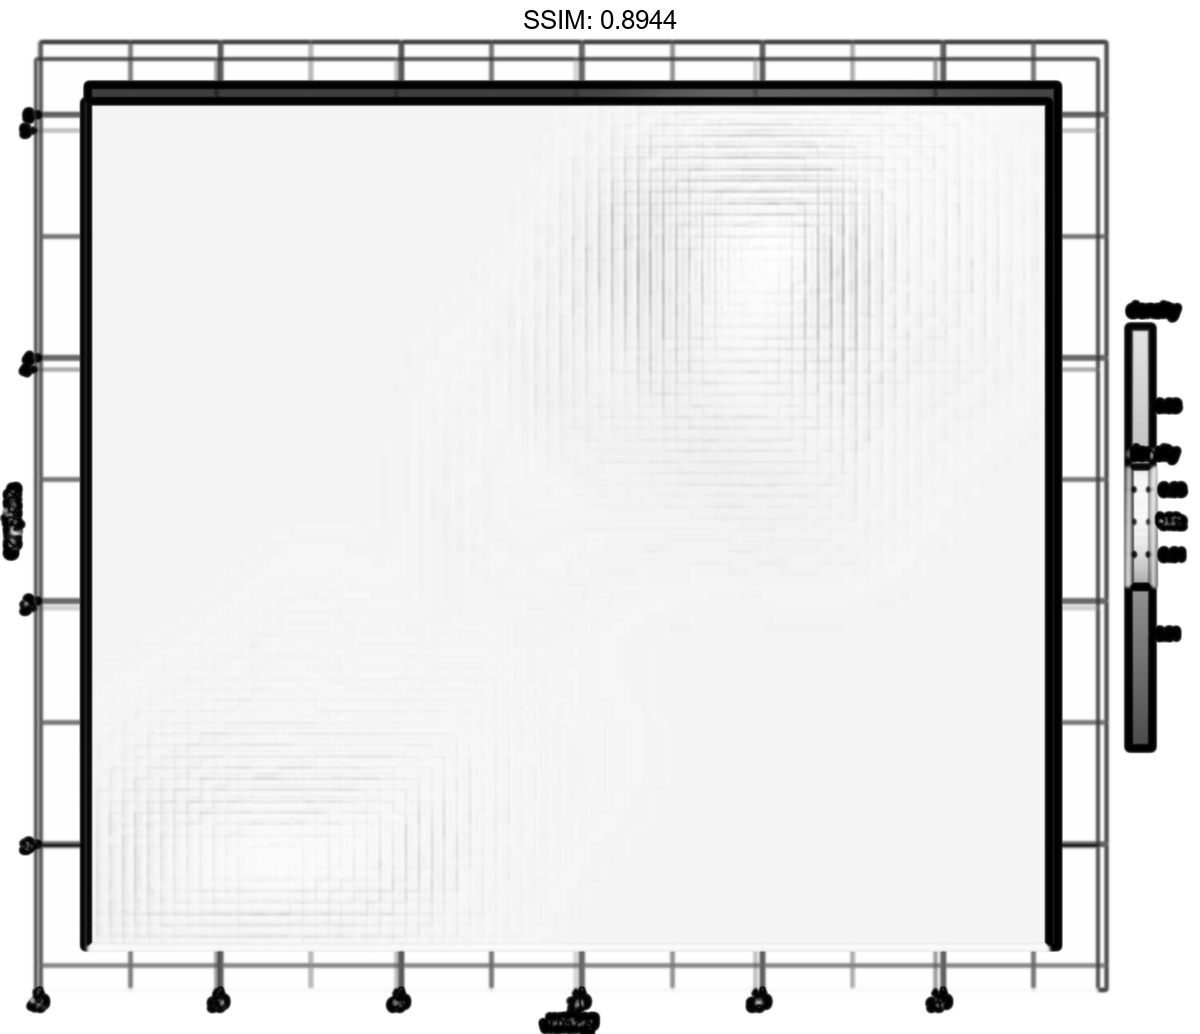
p <-
 ggplot(faithfuld, aes(waiting, eruptions)) +
 geom_raster(aes(fill = density))
plotly::ggplotly(p)

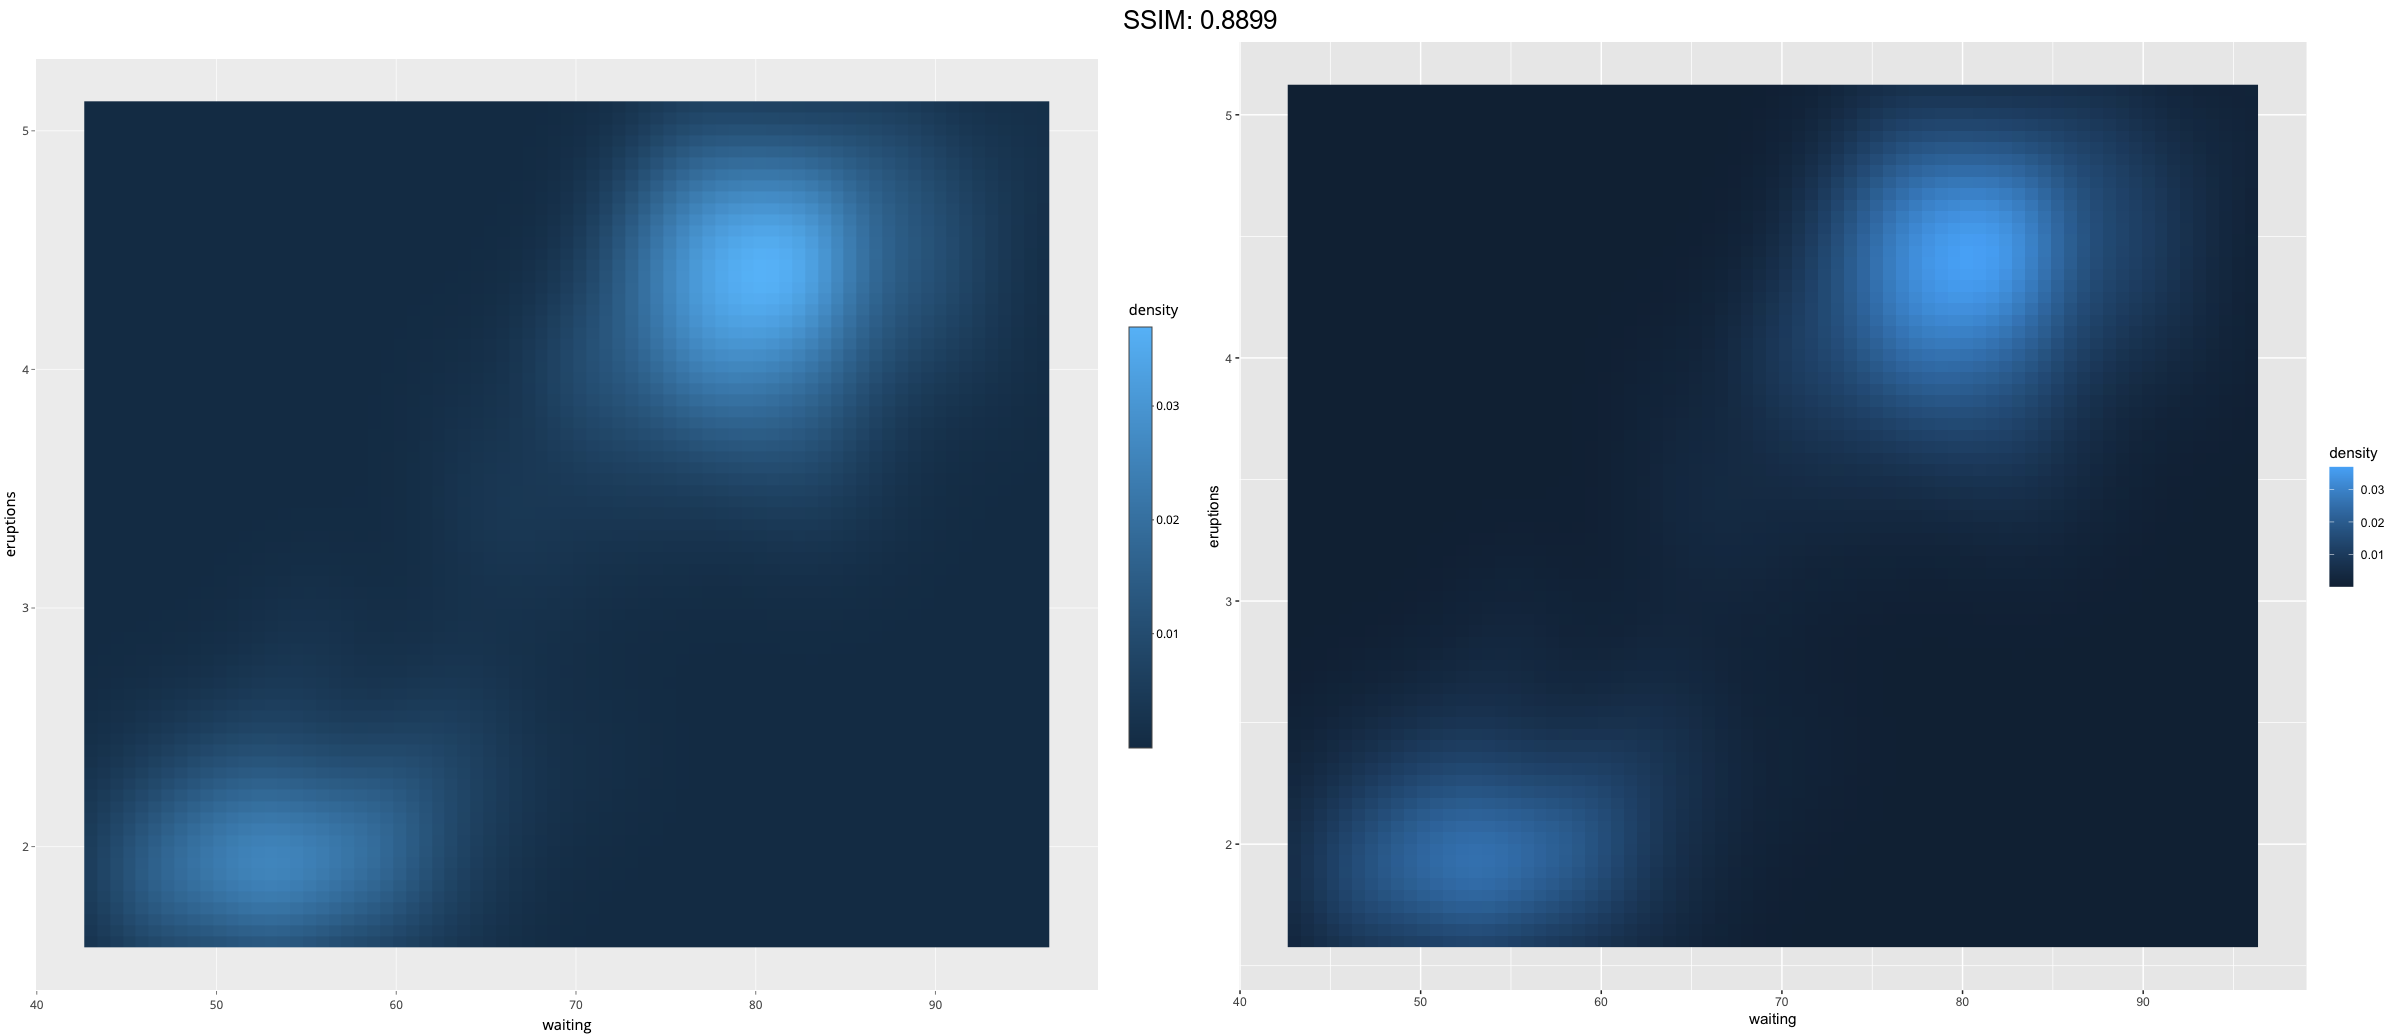
p <-
 ggplot(faithfuld, aes(waiting, eruptions)) +
 geom_raster(aes(fill = density), interpolate = TRUE)
plotly::ggplotly(p)

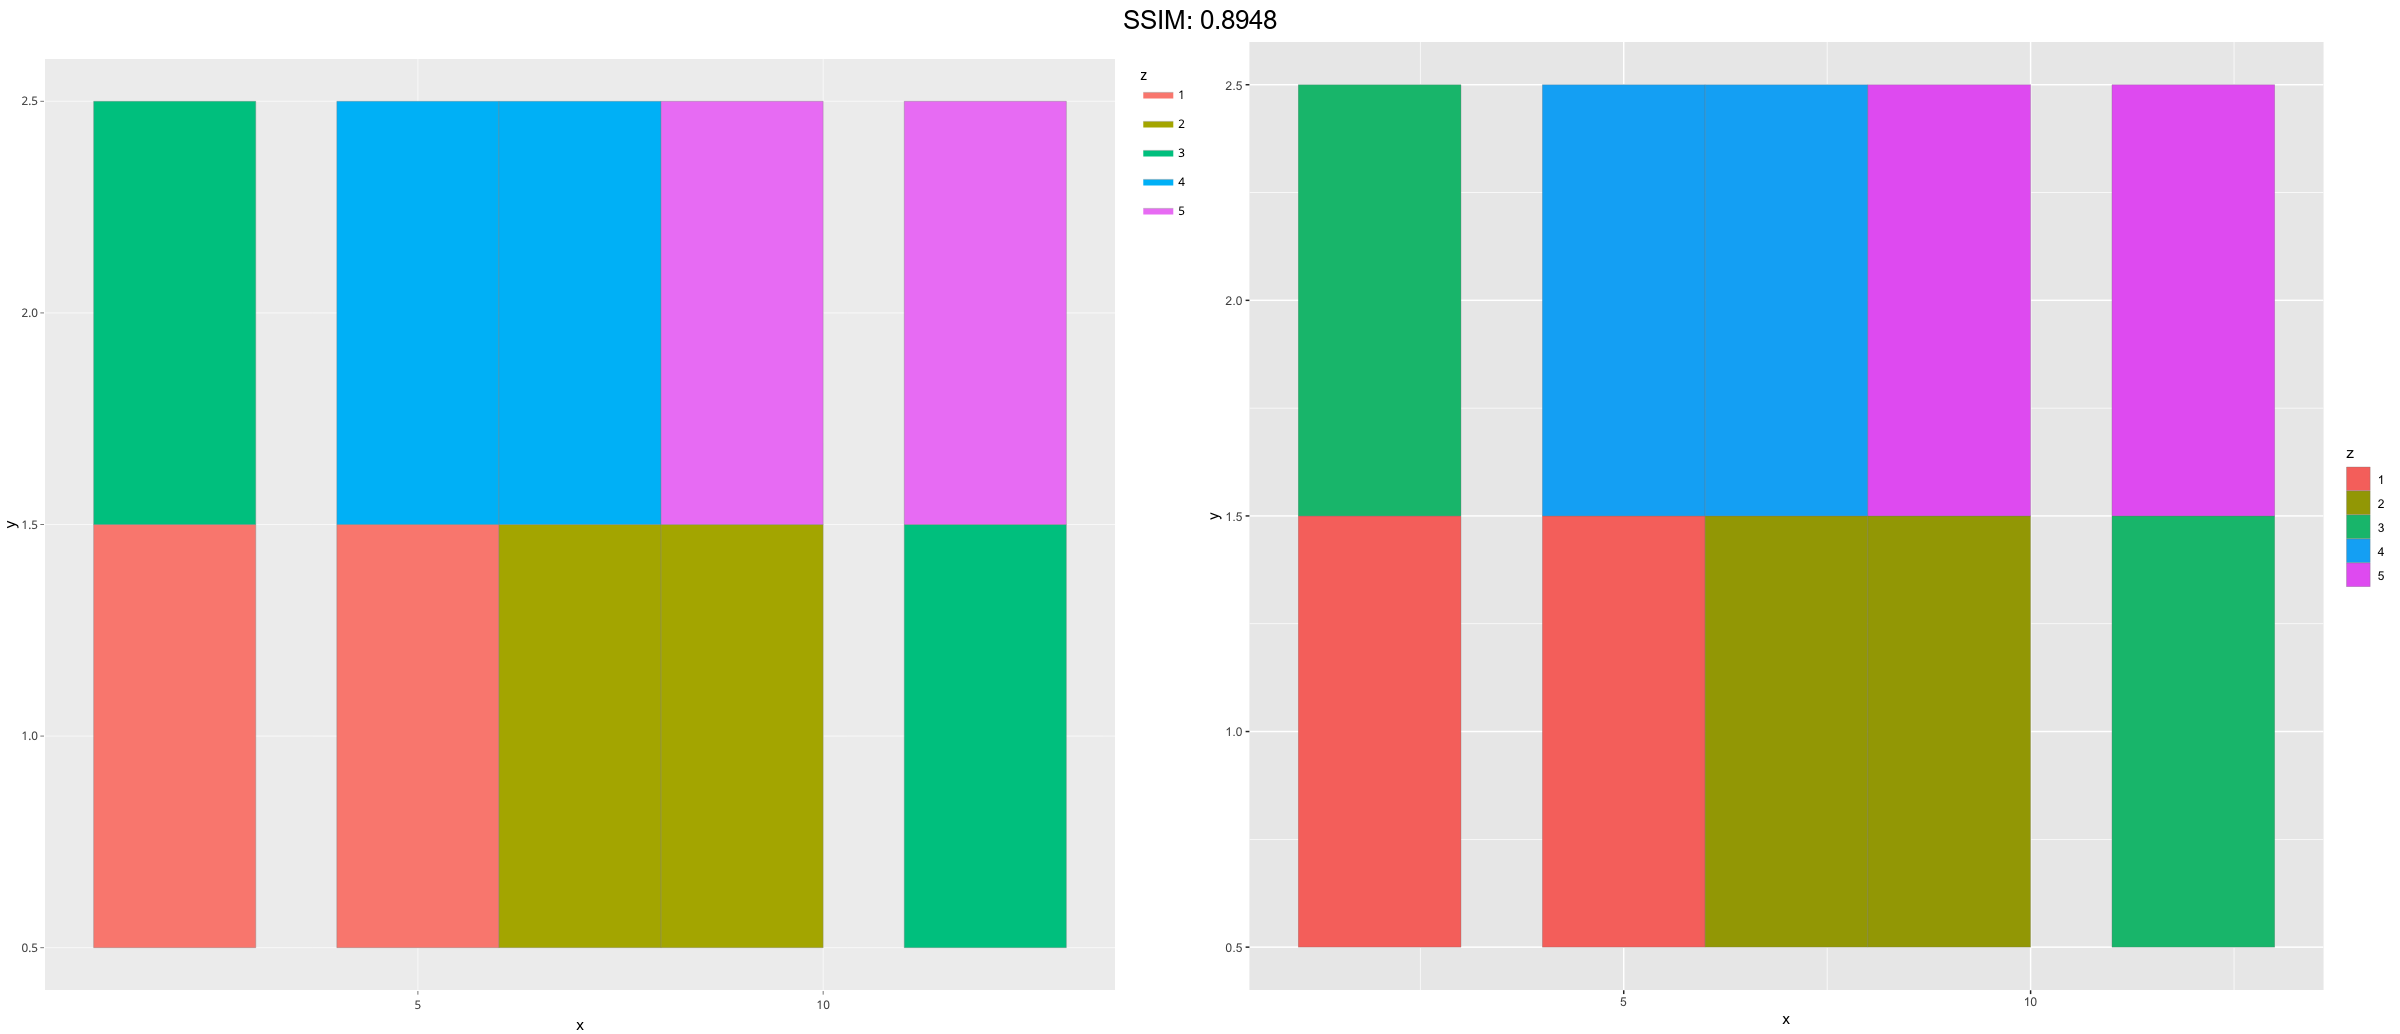
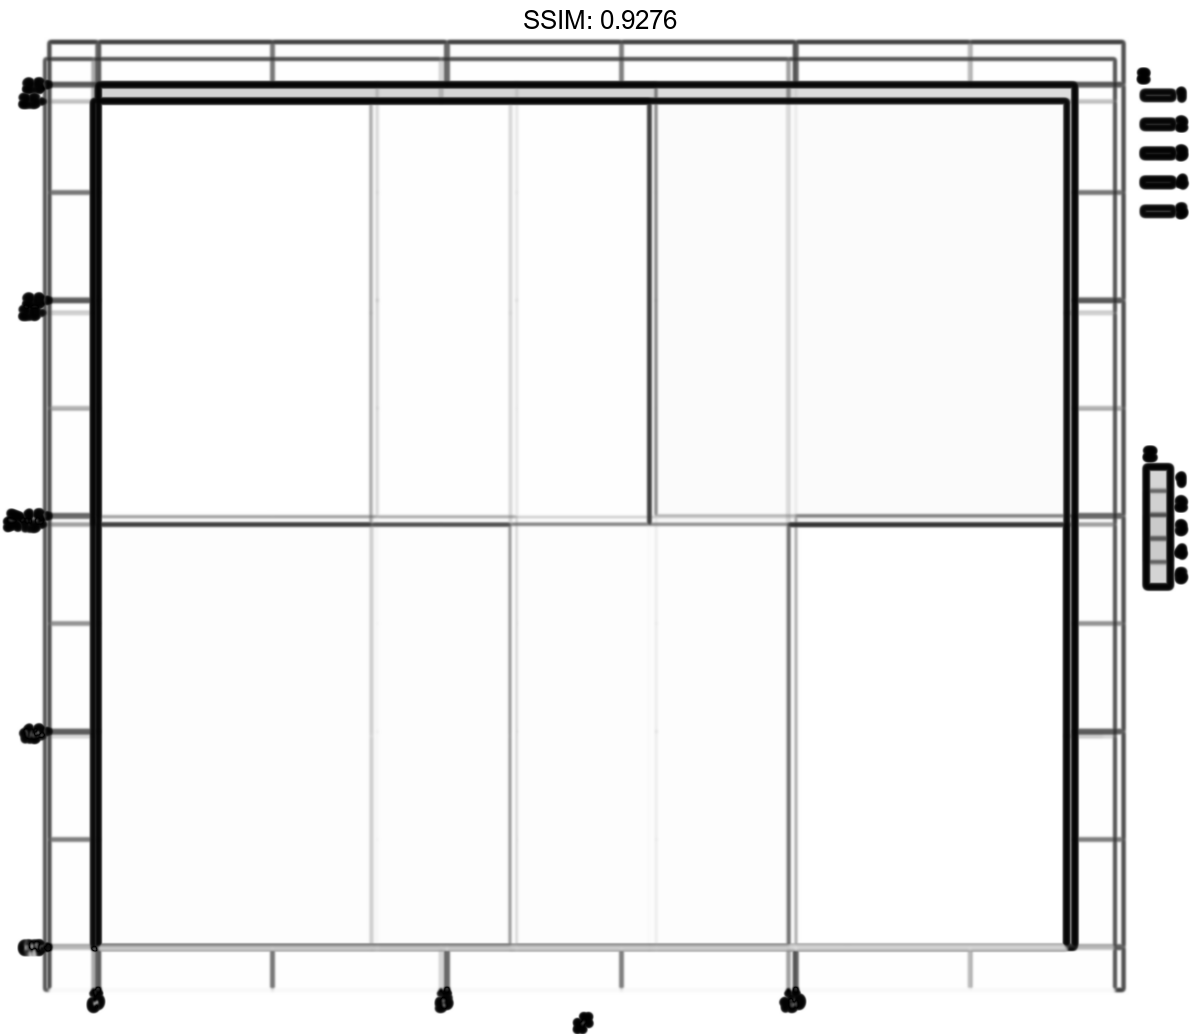
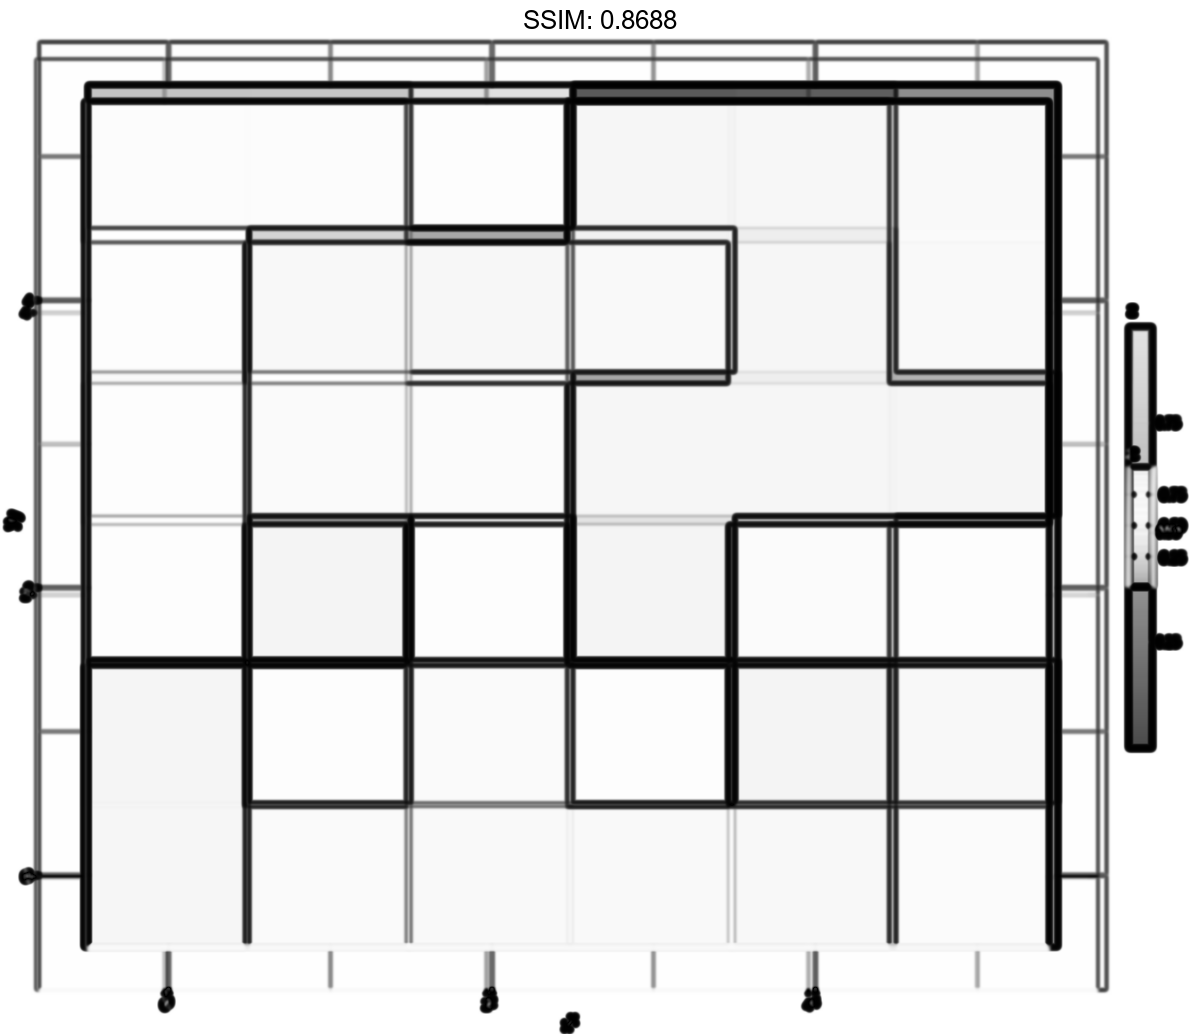
df <- data.frame(
  x = rep(c(2, 5, 7, 9, 12), 2),
  y = rep(c(1, 2), each = 5),
  z = factor(rep(1:5, each = 2)),
  w = rep(diff(c(0, 4, 6, 8, 10, 14)), 2)
)
p <-
 ggplot(df, aes(x, y)) +
  geom_tile(aes(fill = z), colour = "grey50")
plotly::ggplotly(p)
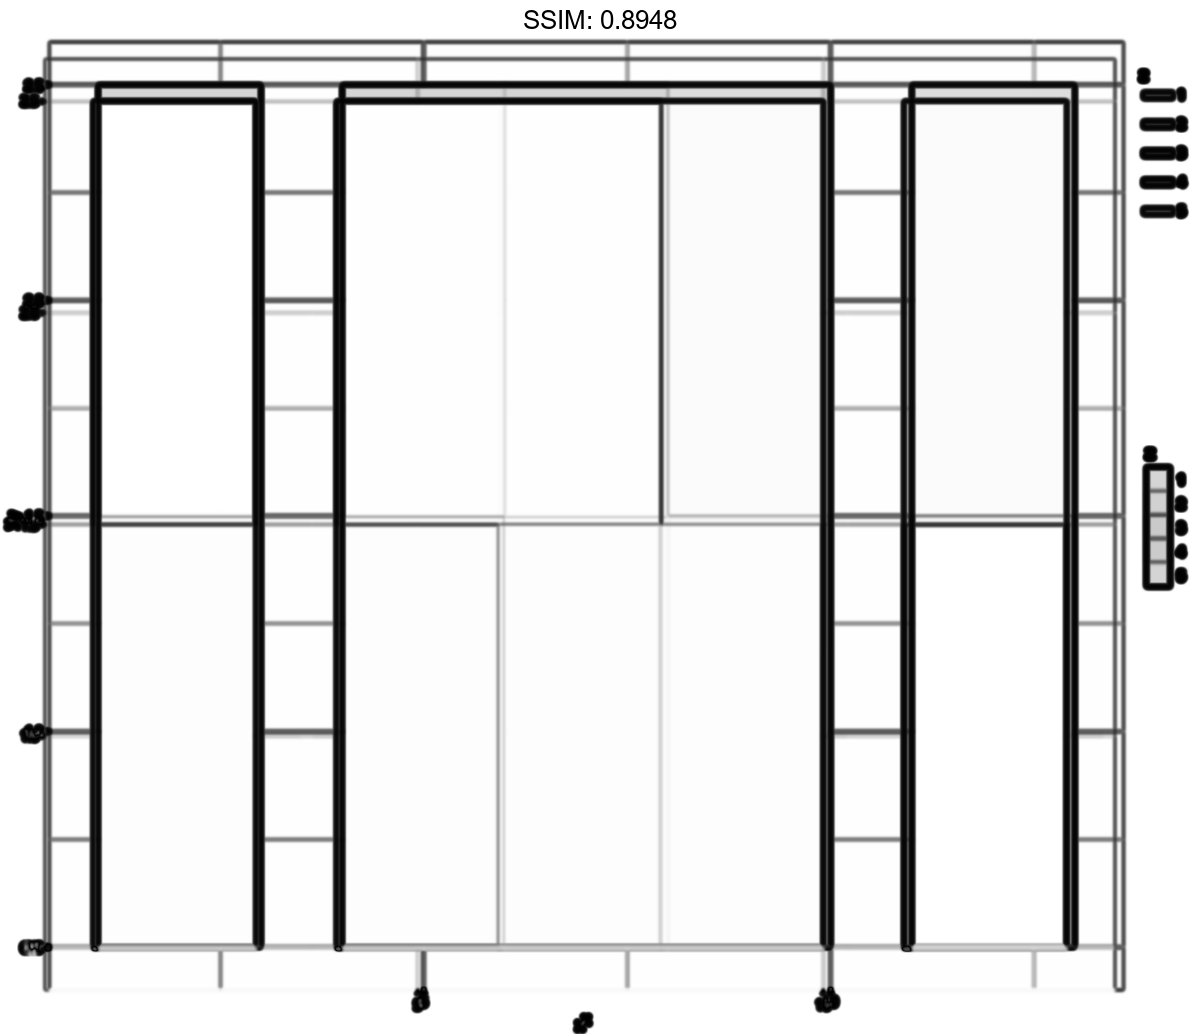
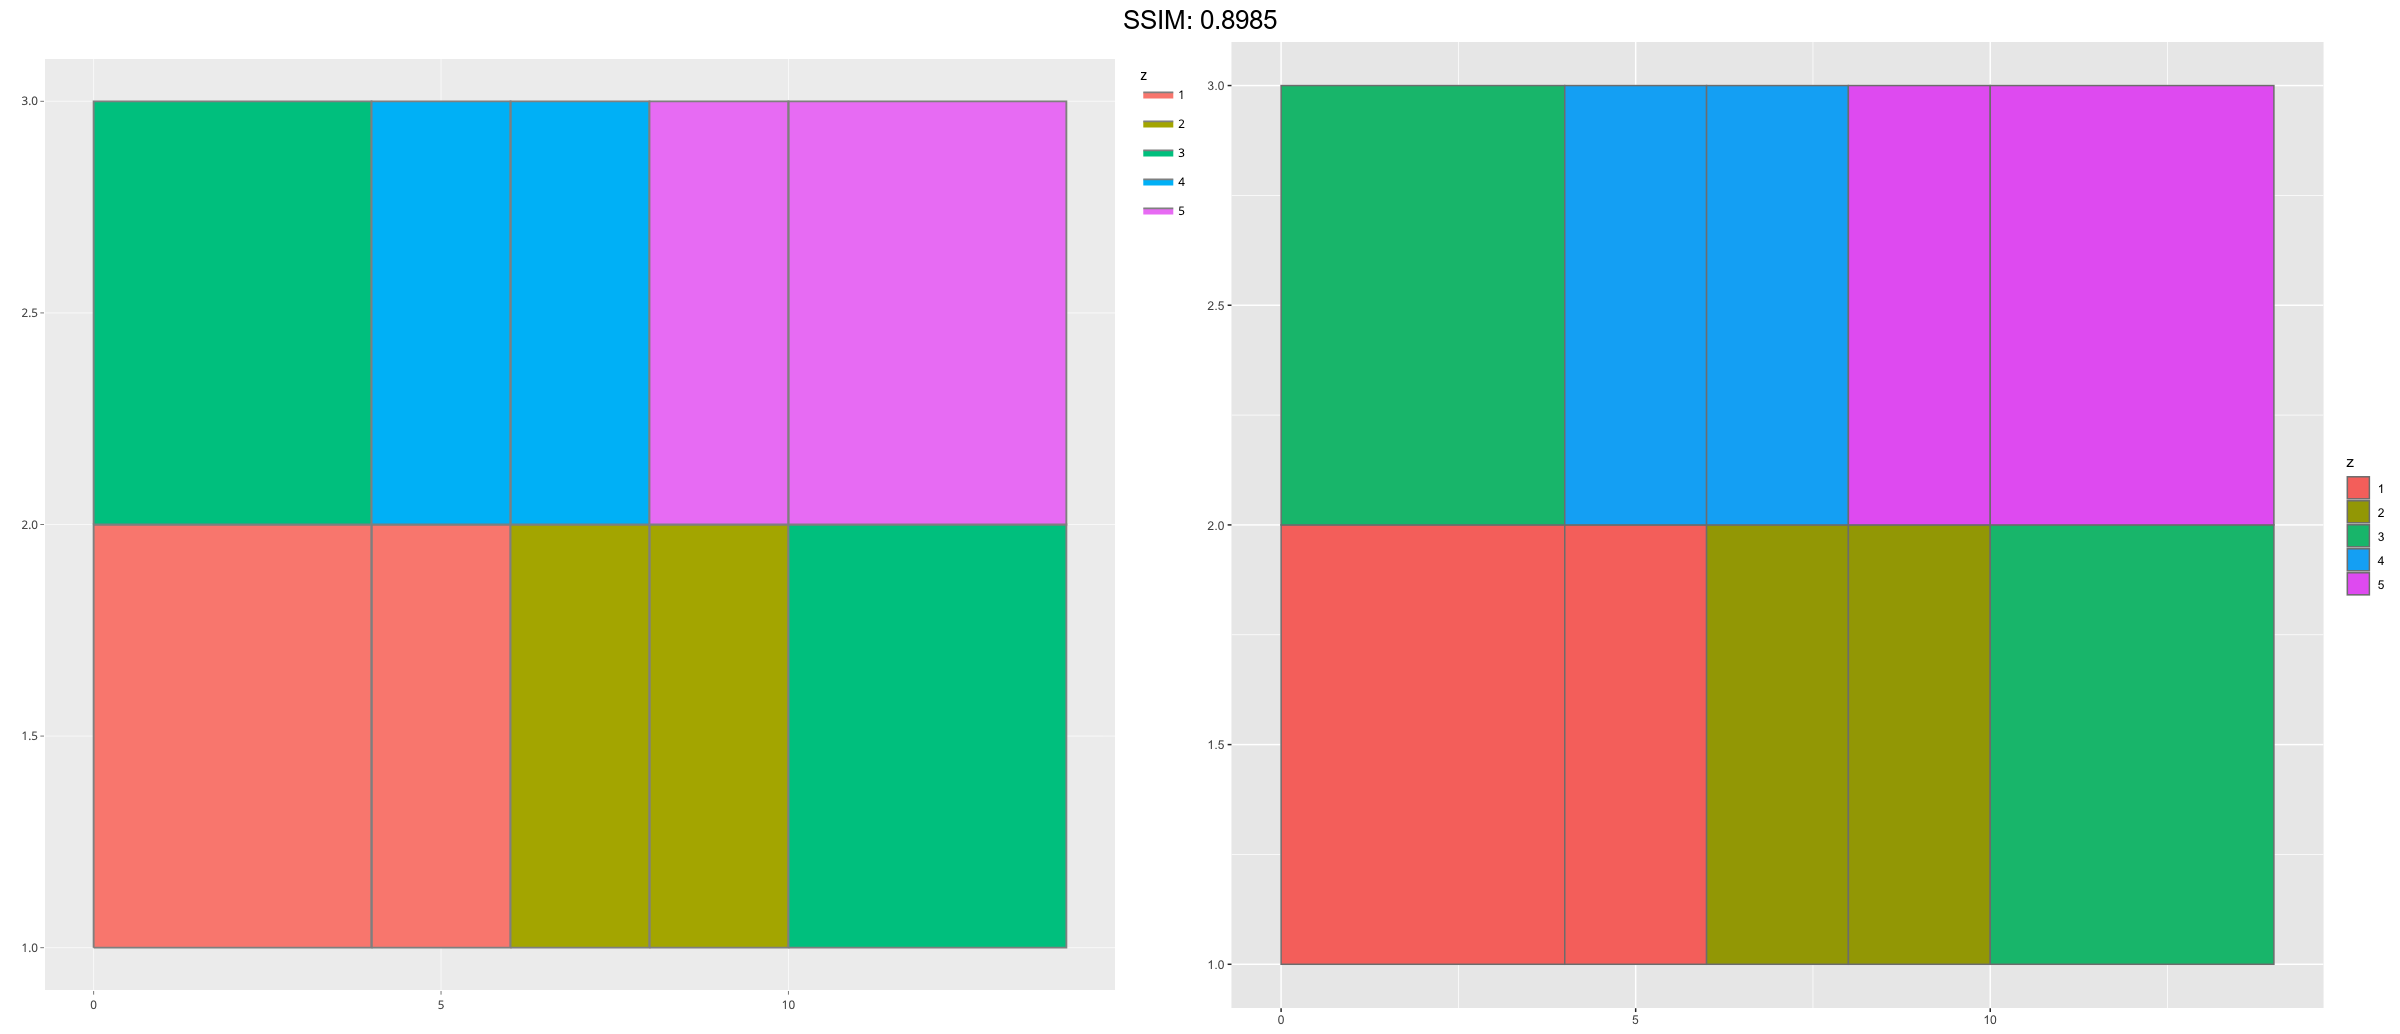
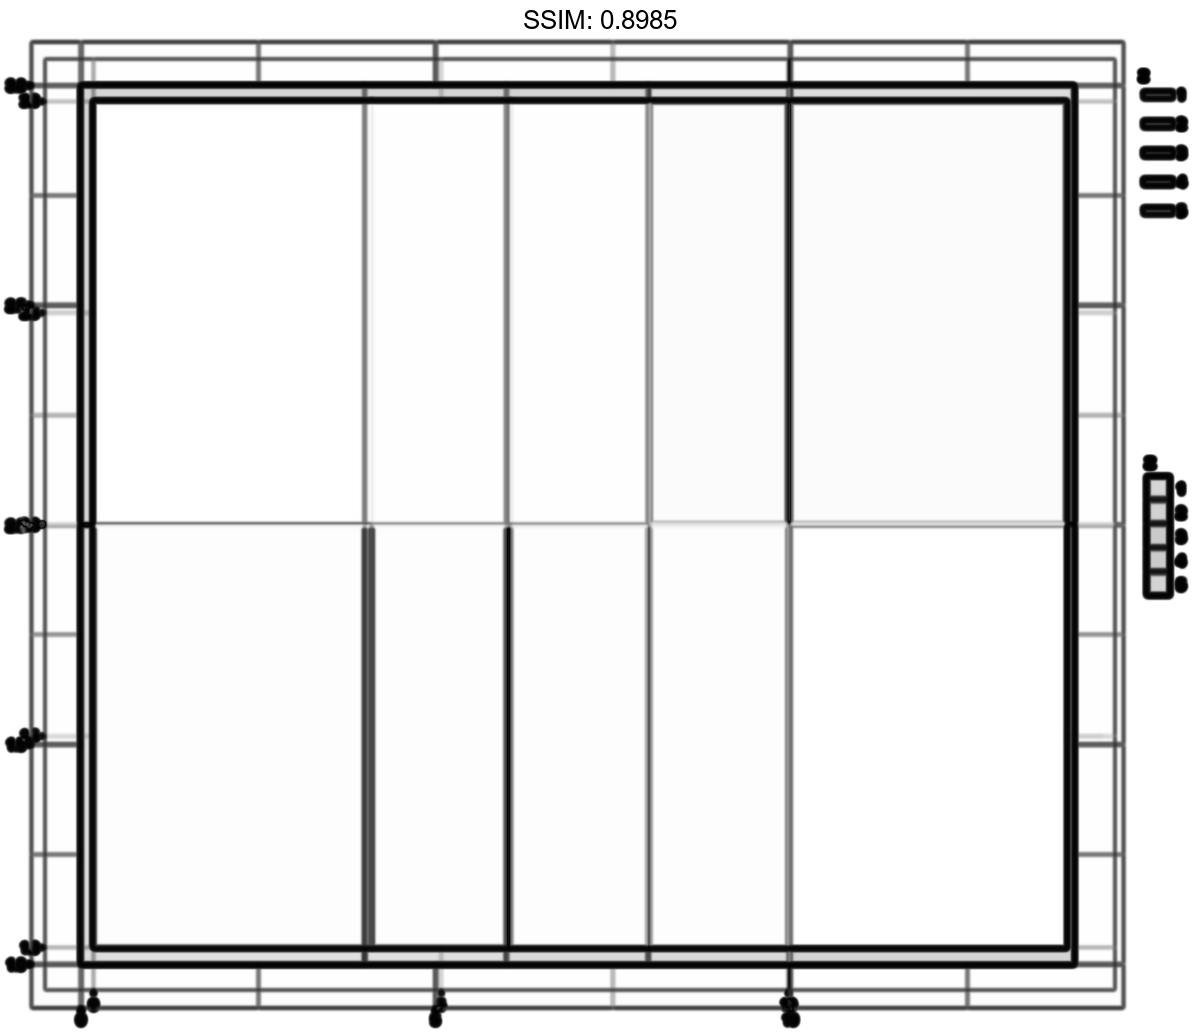
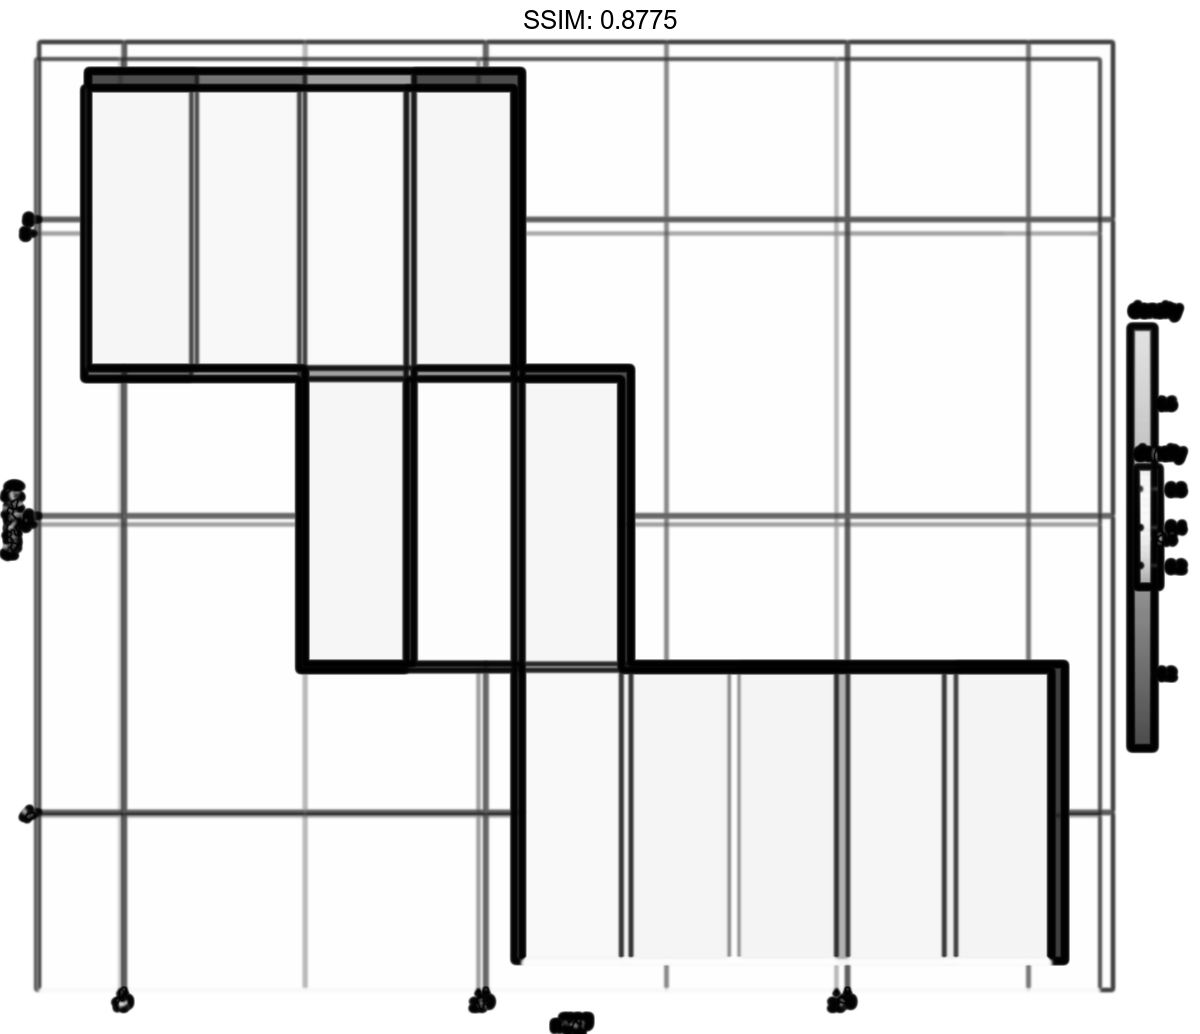
df <- data.frame(
  x = rep(c(2, 5, 7, 9, 12), 2),
  y = rep(c(1, 2), each = 5),
  z = factor(rep(1:5, each = 2)),
  w = rep(diff(c(0, 4, 6, 8, 10, 14)), 2)
)
p <-
 ggplot(df, aes(x, y, width = w)) +
  geom_tile(aes(fill = z), colour = "grey50")
plotly::ggplotly(p)
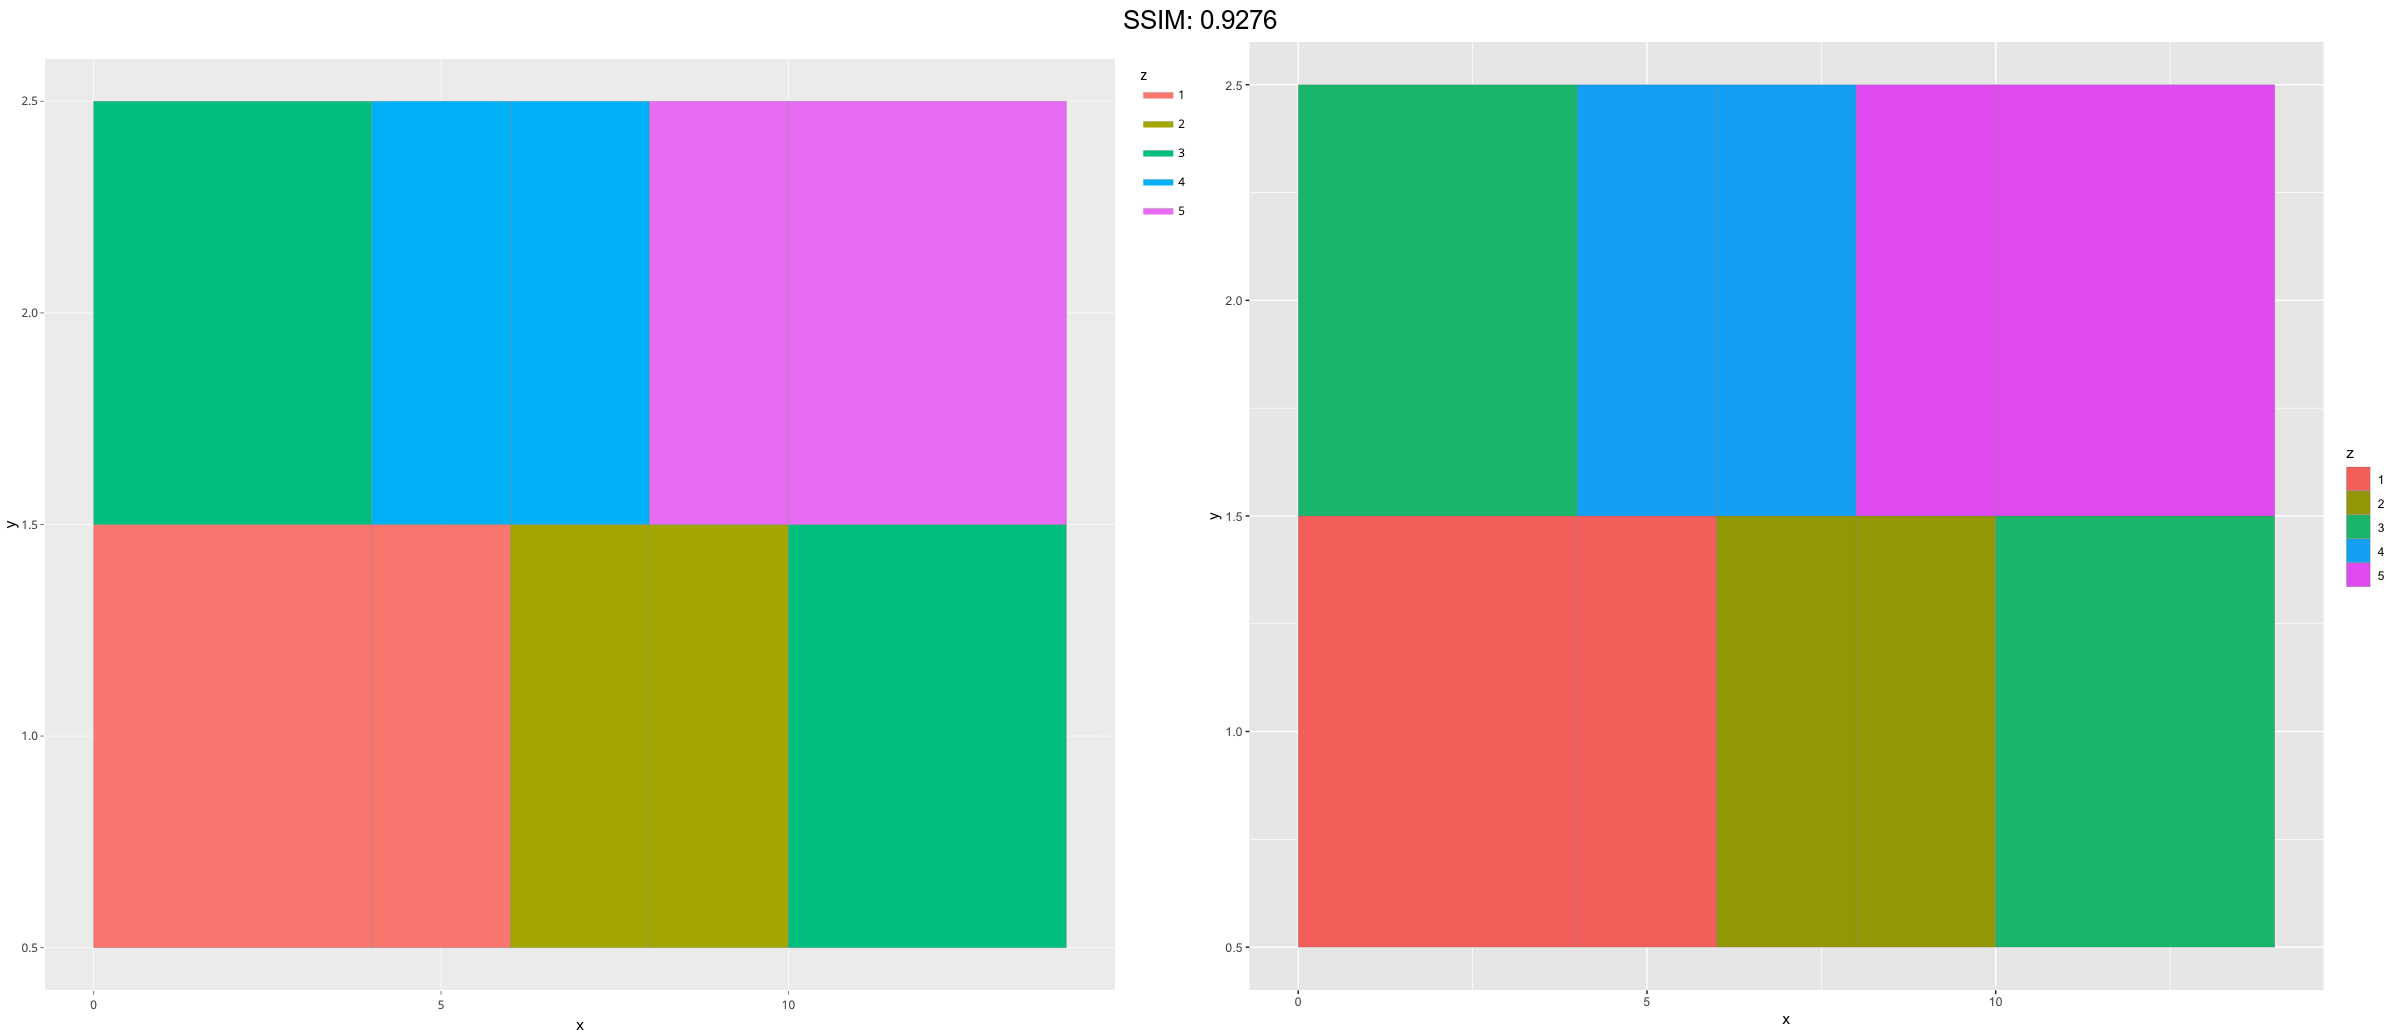
df <- data.frame(
  x = rep(c(2, 5, 7, 9, 12), 2),
  y = rep(c(1, 2), each = 5),
  z = factor(rep(1:5, each = 2)),
  w = rep(diff(c(0, 4, 6, 8, 10, 14)), 2)
)
p <-
 ggplot(df, aes(xmin = x - w / 2, xmax = x + w / 2, ymin = y, ymax = y + 1)) +
  geom_rect(aes(fill = z), colour = "grey50")
plotly::ggplotly(p)
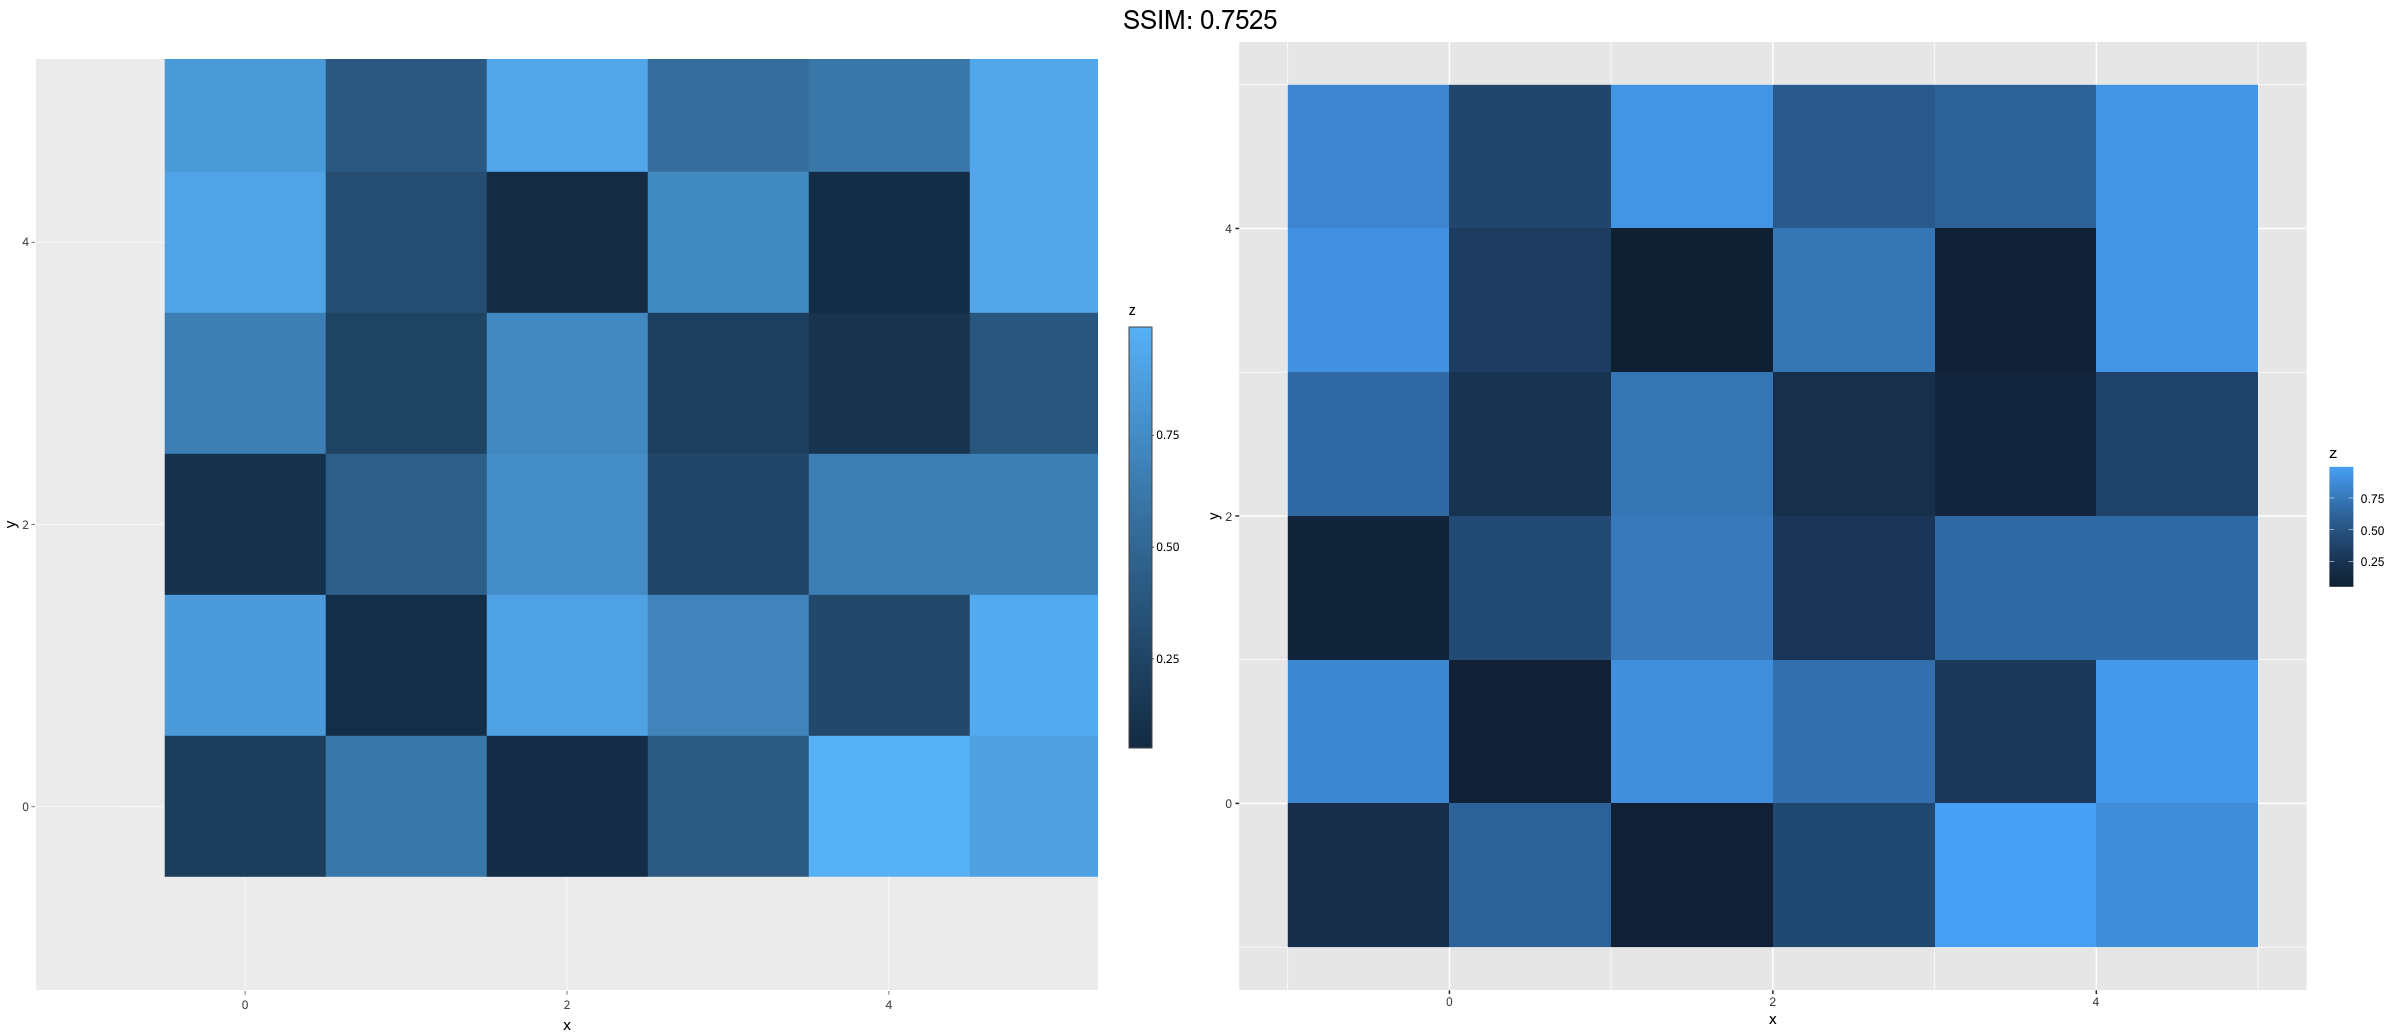
df <- expand.grid(x = 0:5, y = 0:5)
df$z <- runif(nrow(df))
p <-
 ggplot(df, aes(x, y, fill = z)) +
  geom_raster()
plotly::ggplotly(p)
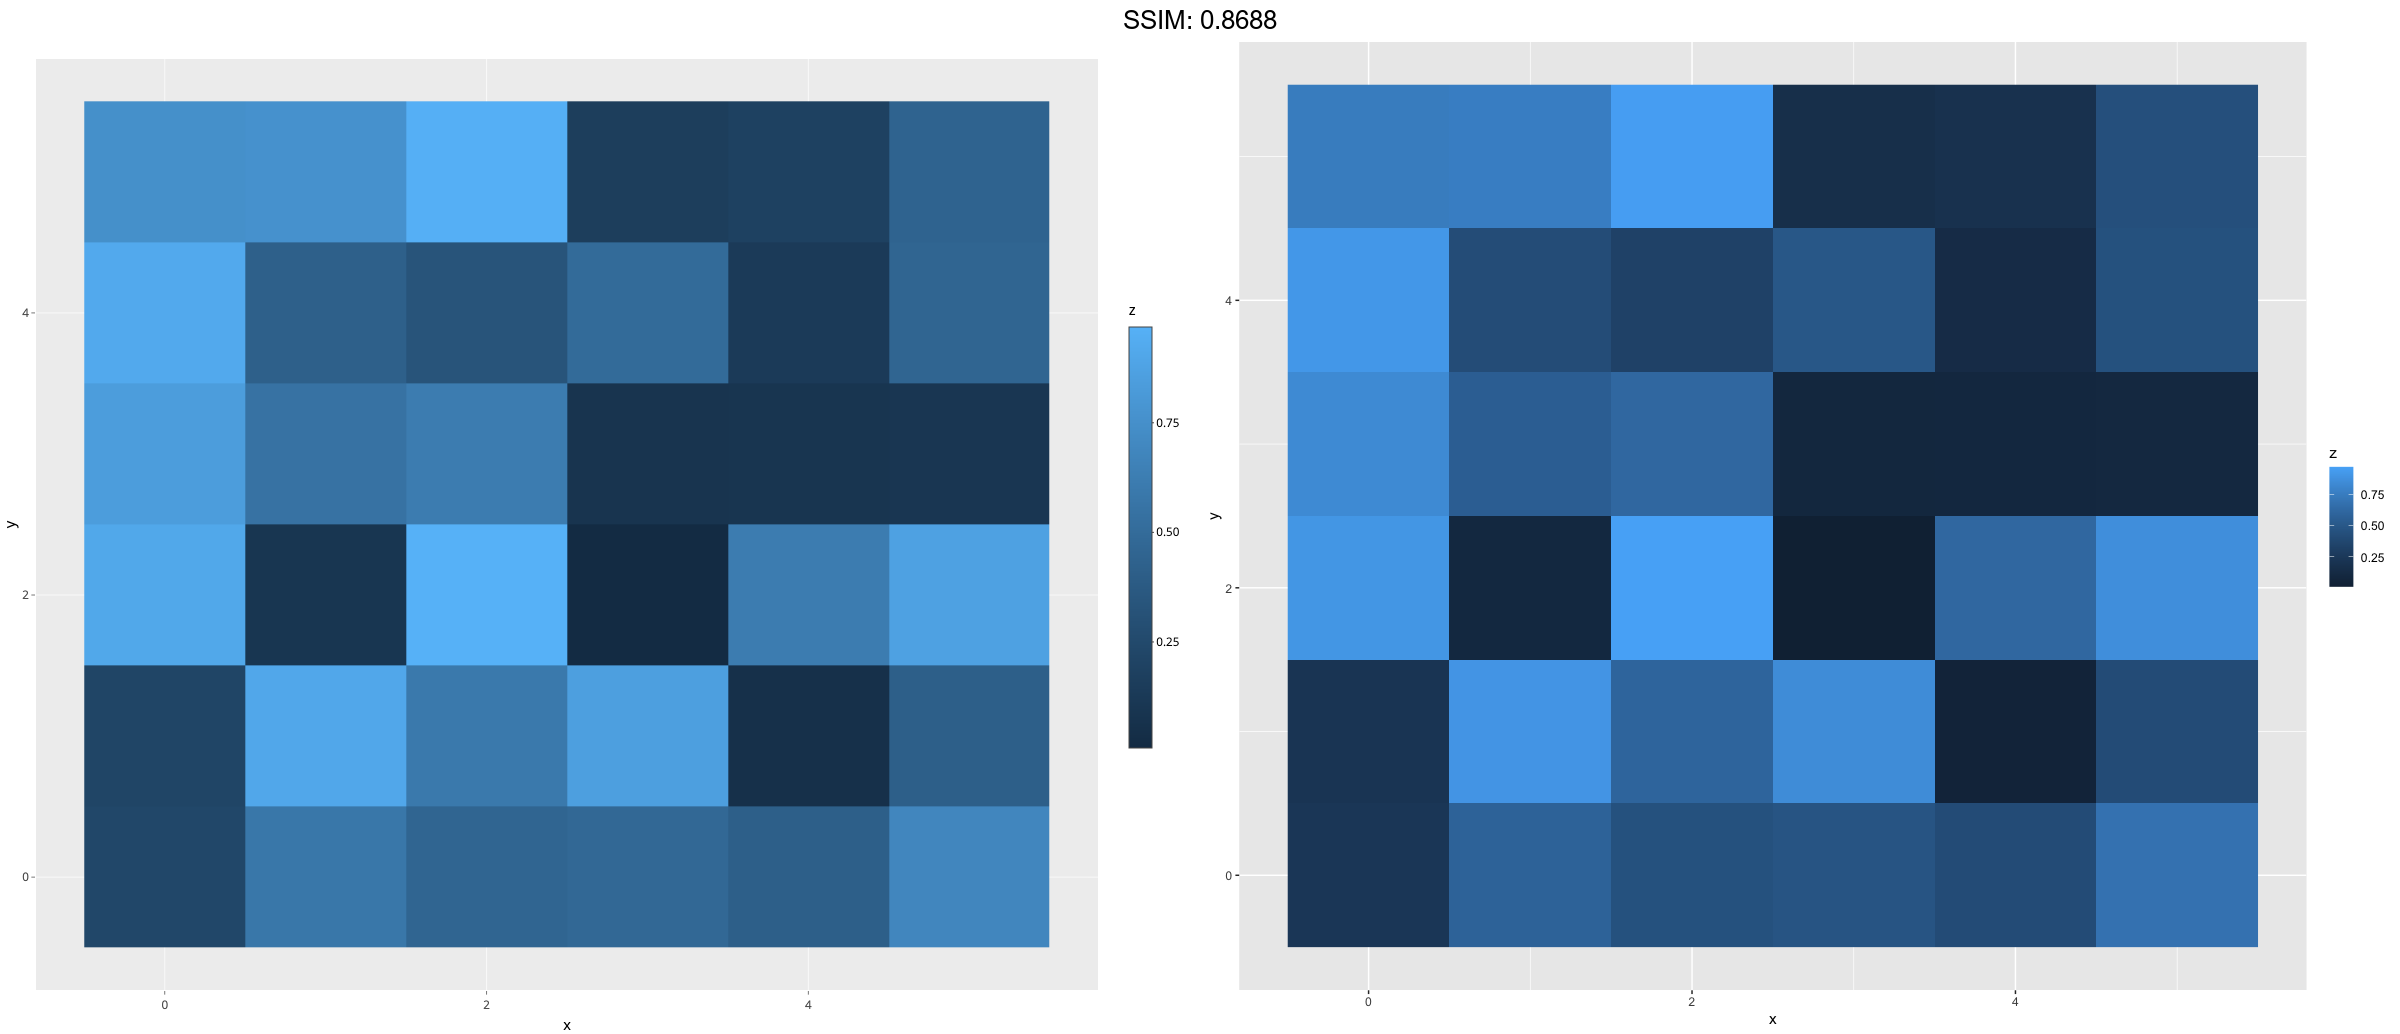
df <- expand.grid(x = 0:5, y = 0:5)
df$z <- runif(nrow(df))
p <-
 ggplot(df, aes(x, y, fill = z)) +
  geom_raster(hjust = 0, vjust = 0)
plotly::ggplotly(p)
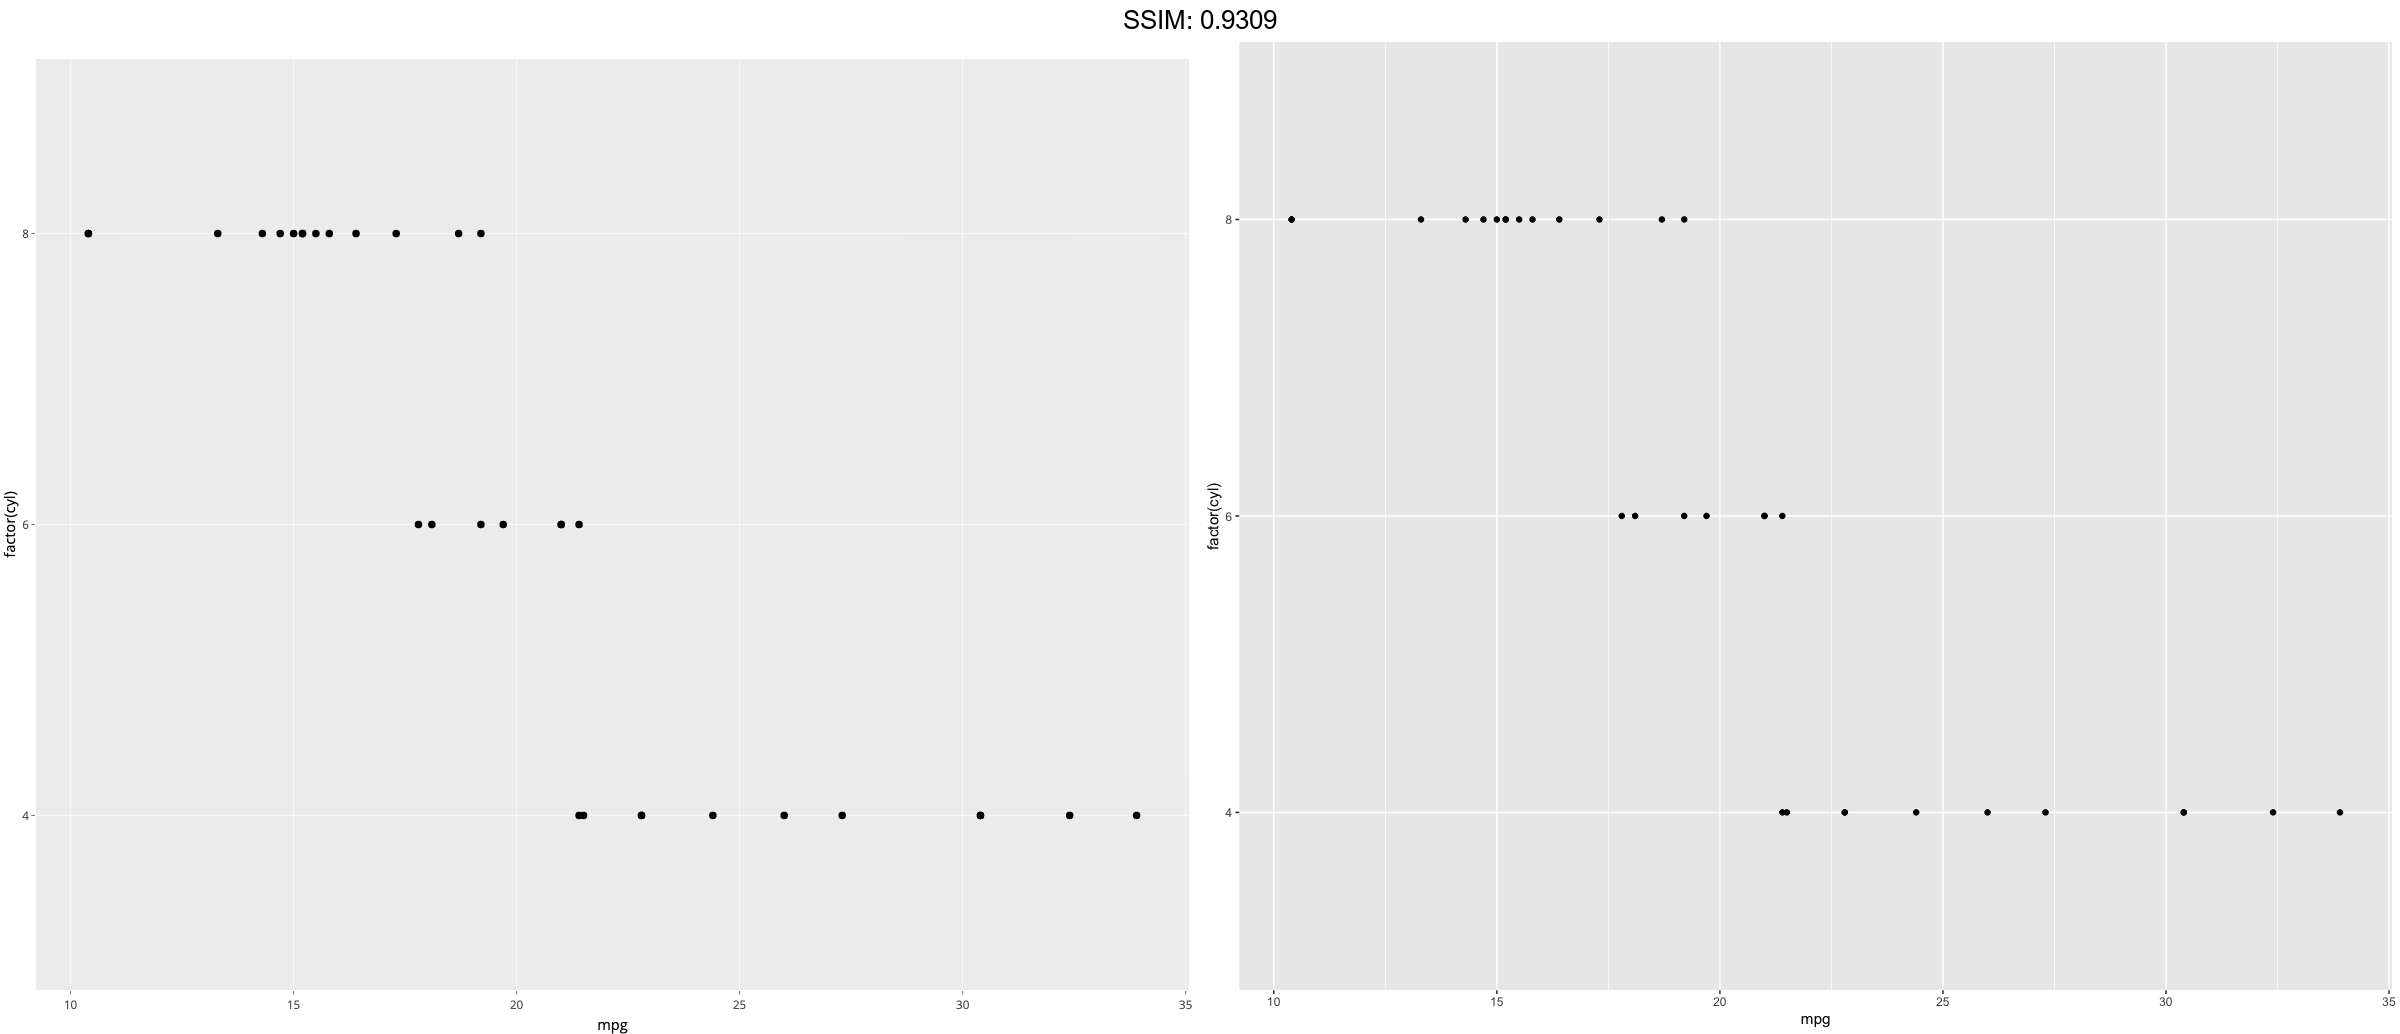
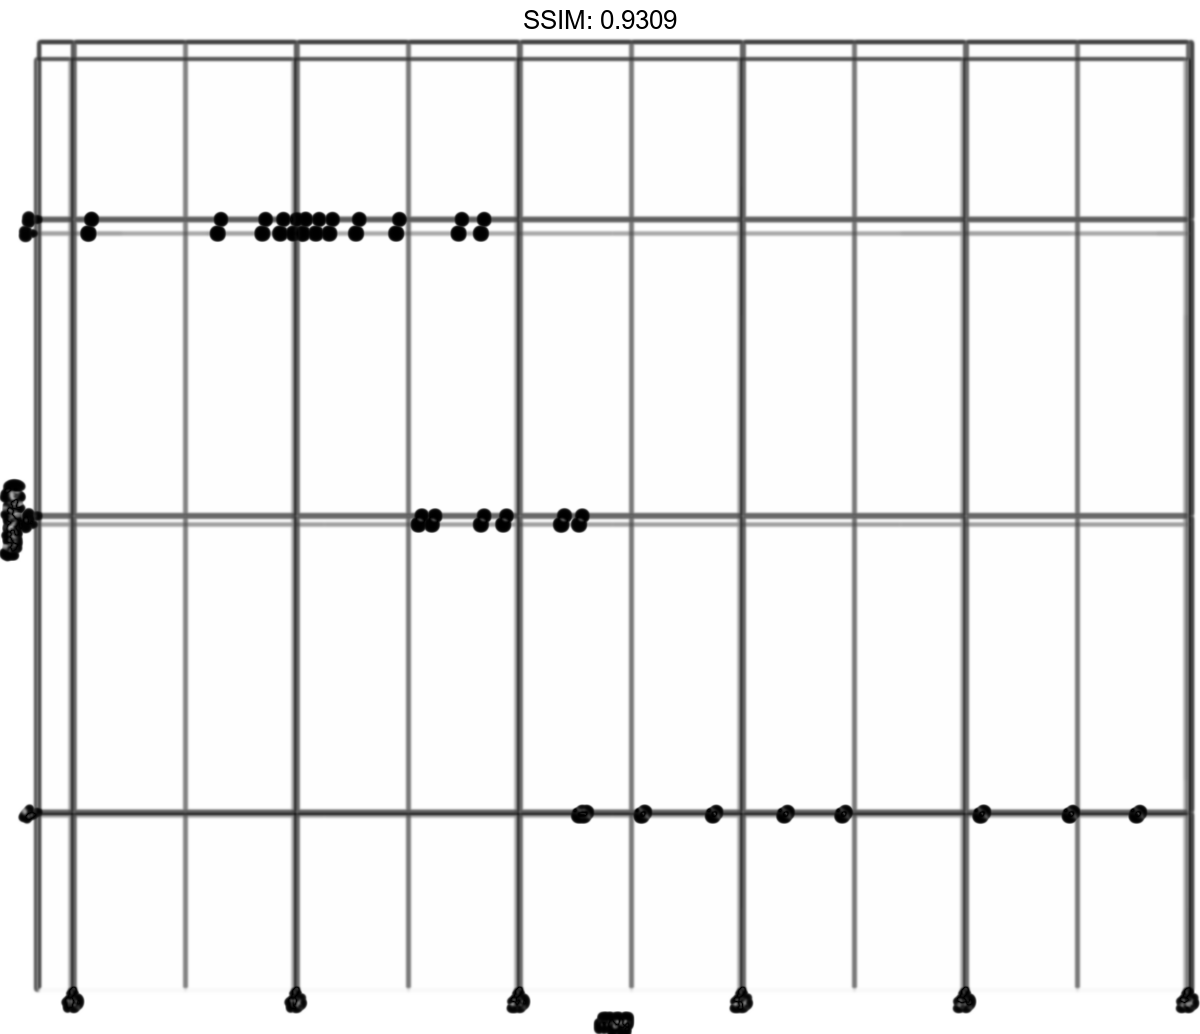
cars <- ggplot(mtcars, aes(mpg, factor(cyl)))
p <- cars + geom_point()
plotly::ggplotly(p)
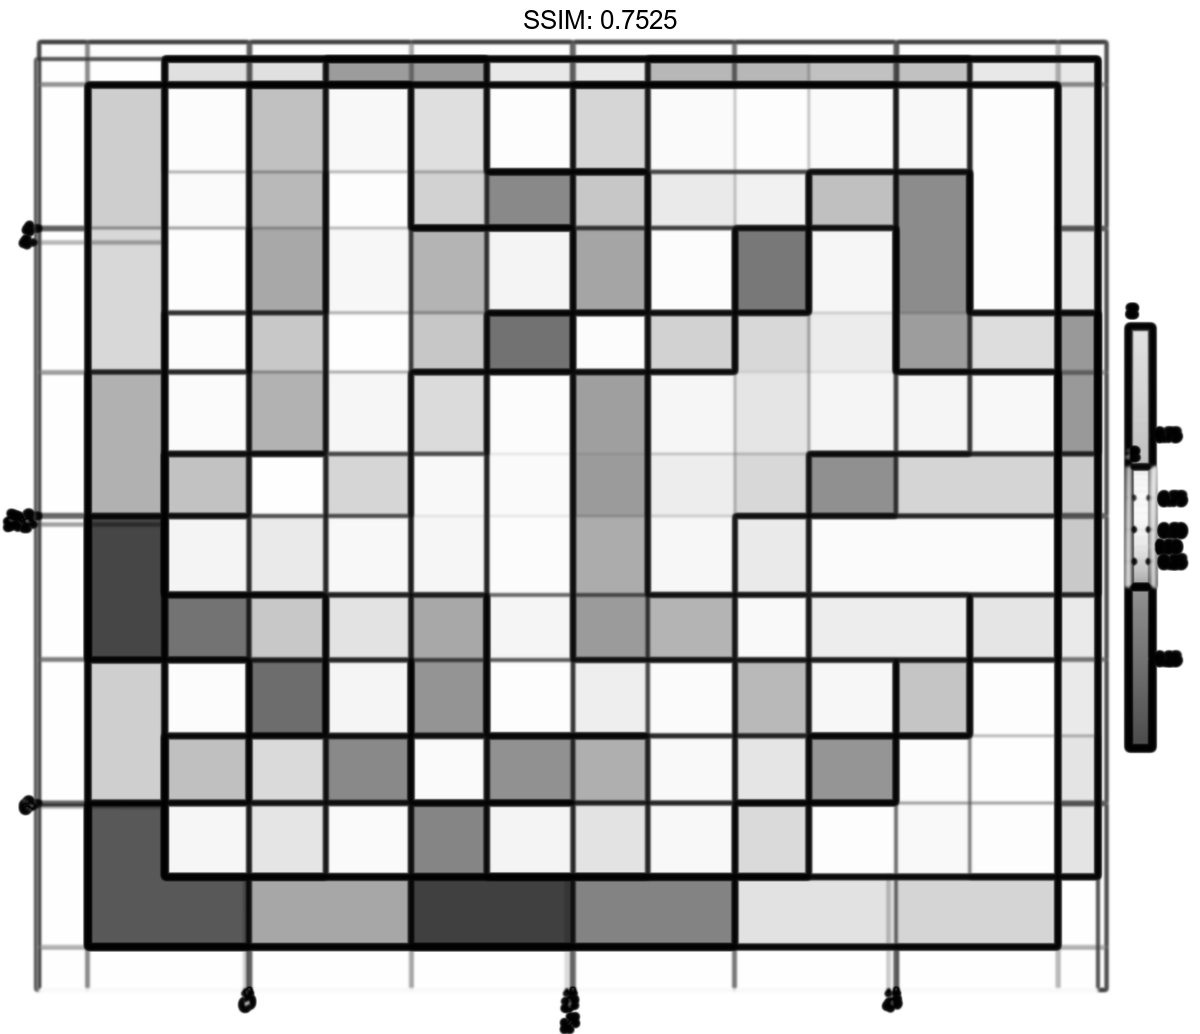
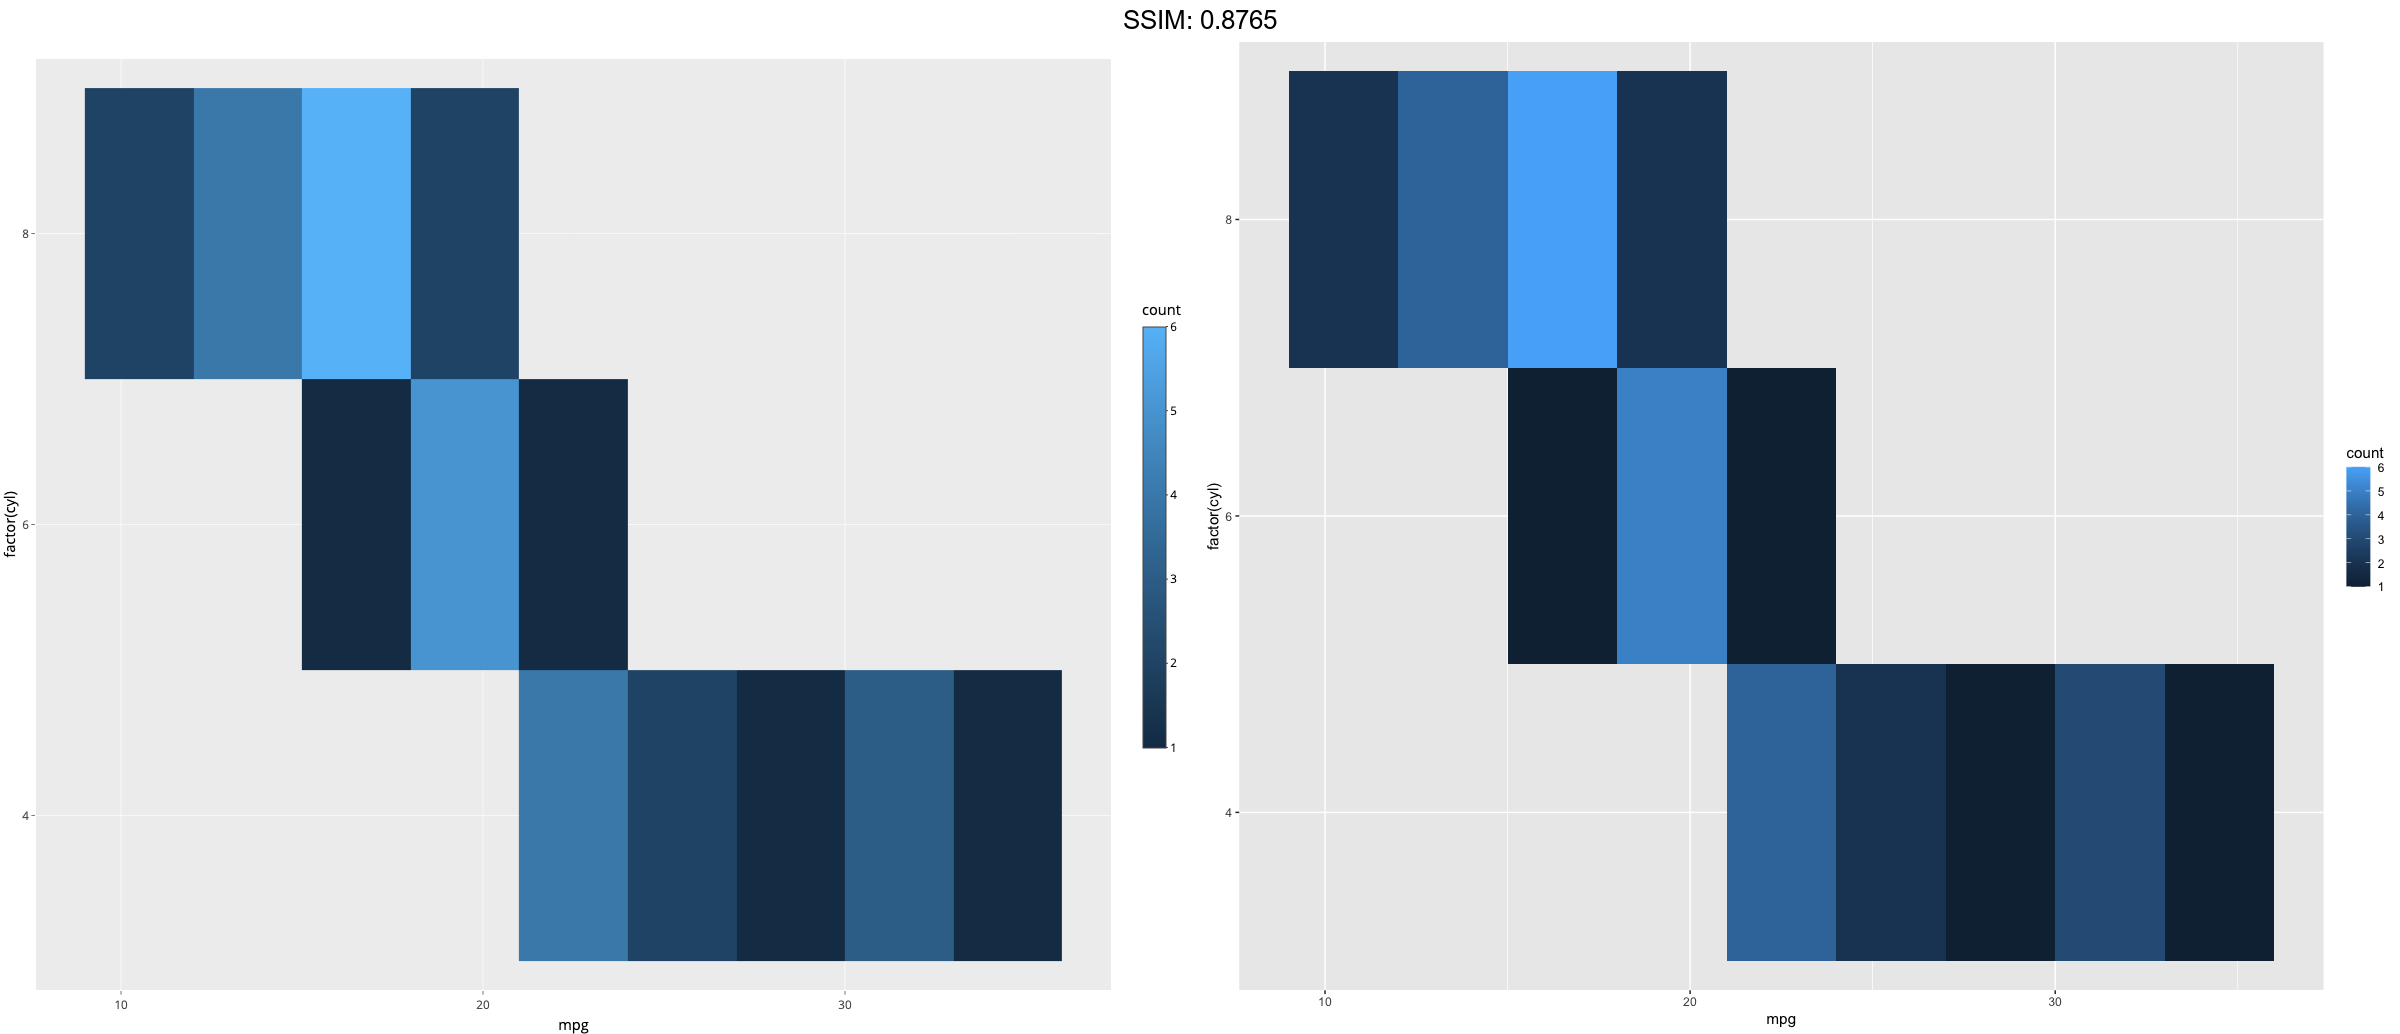
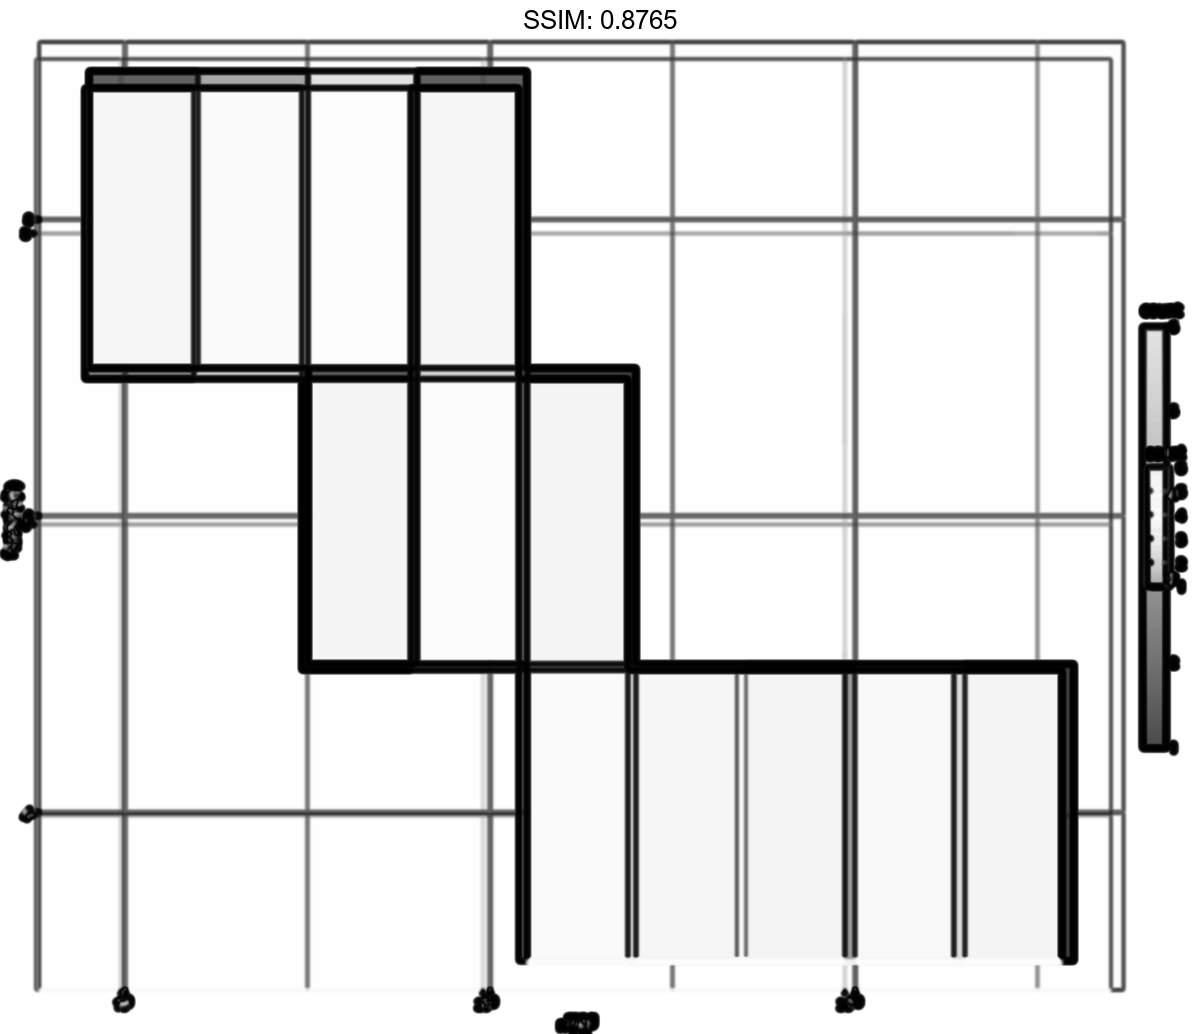
cars <- ggplot(mtcars, aes(mpg, factor(cyl)))
p <- cars + stat_bin2d(aes(fill = after_stat(count)), binwidth = c(3,1))
plotly::ggplotly(p)
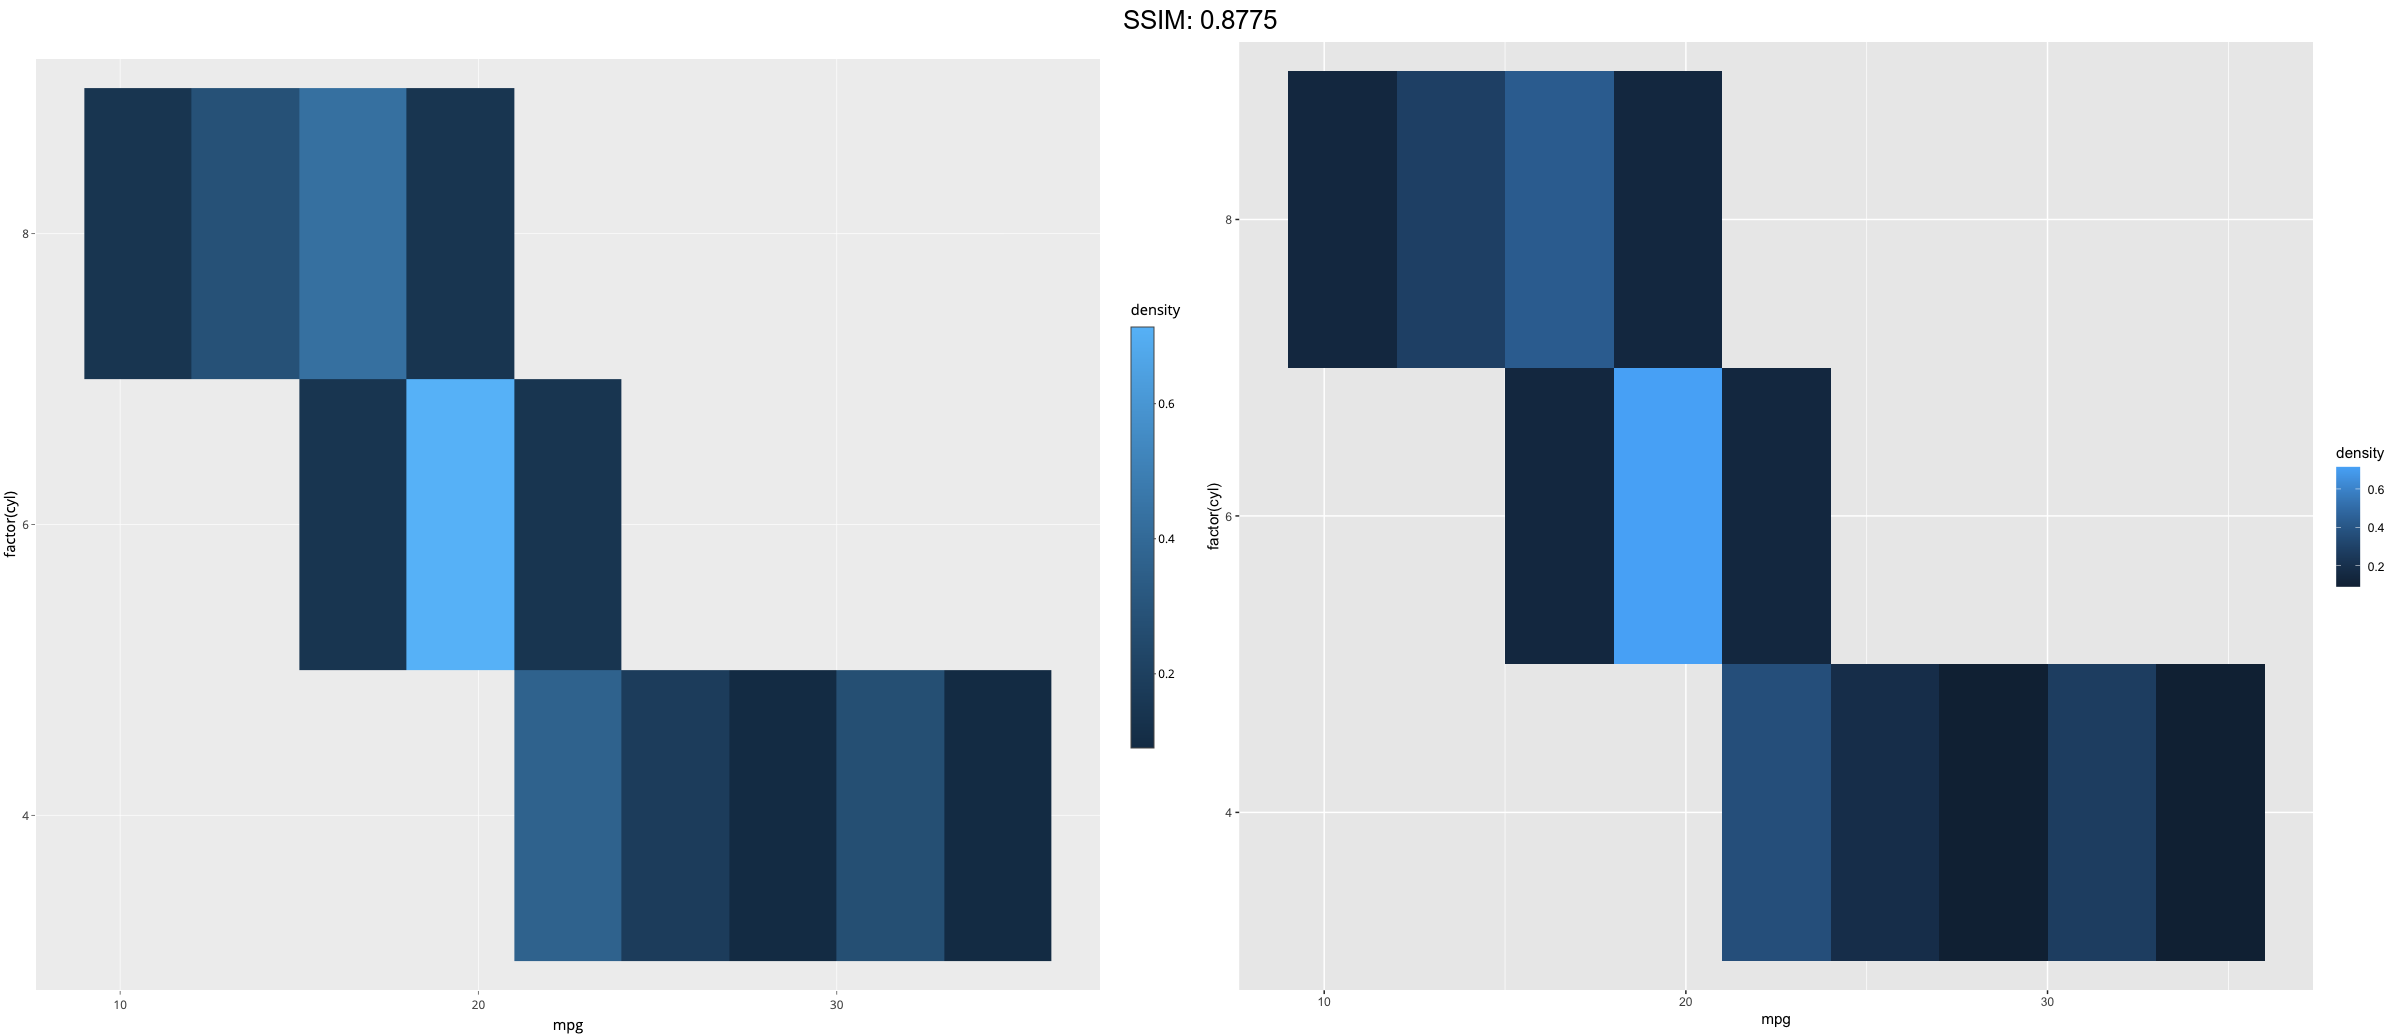
cars <- ggplot(mtcars, aes(mpg, factor(cyl)))
p <- cars + stat_bin2d(aes(fill = after_stat(density)), binwidth = c(3,1))
plotly::ggplotly(p)
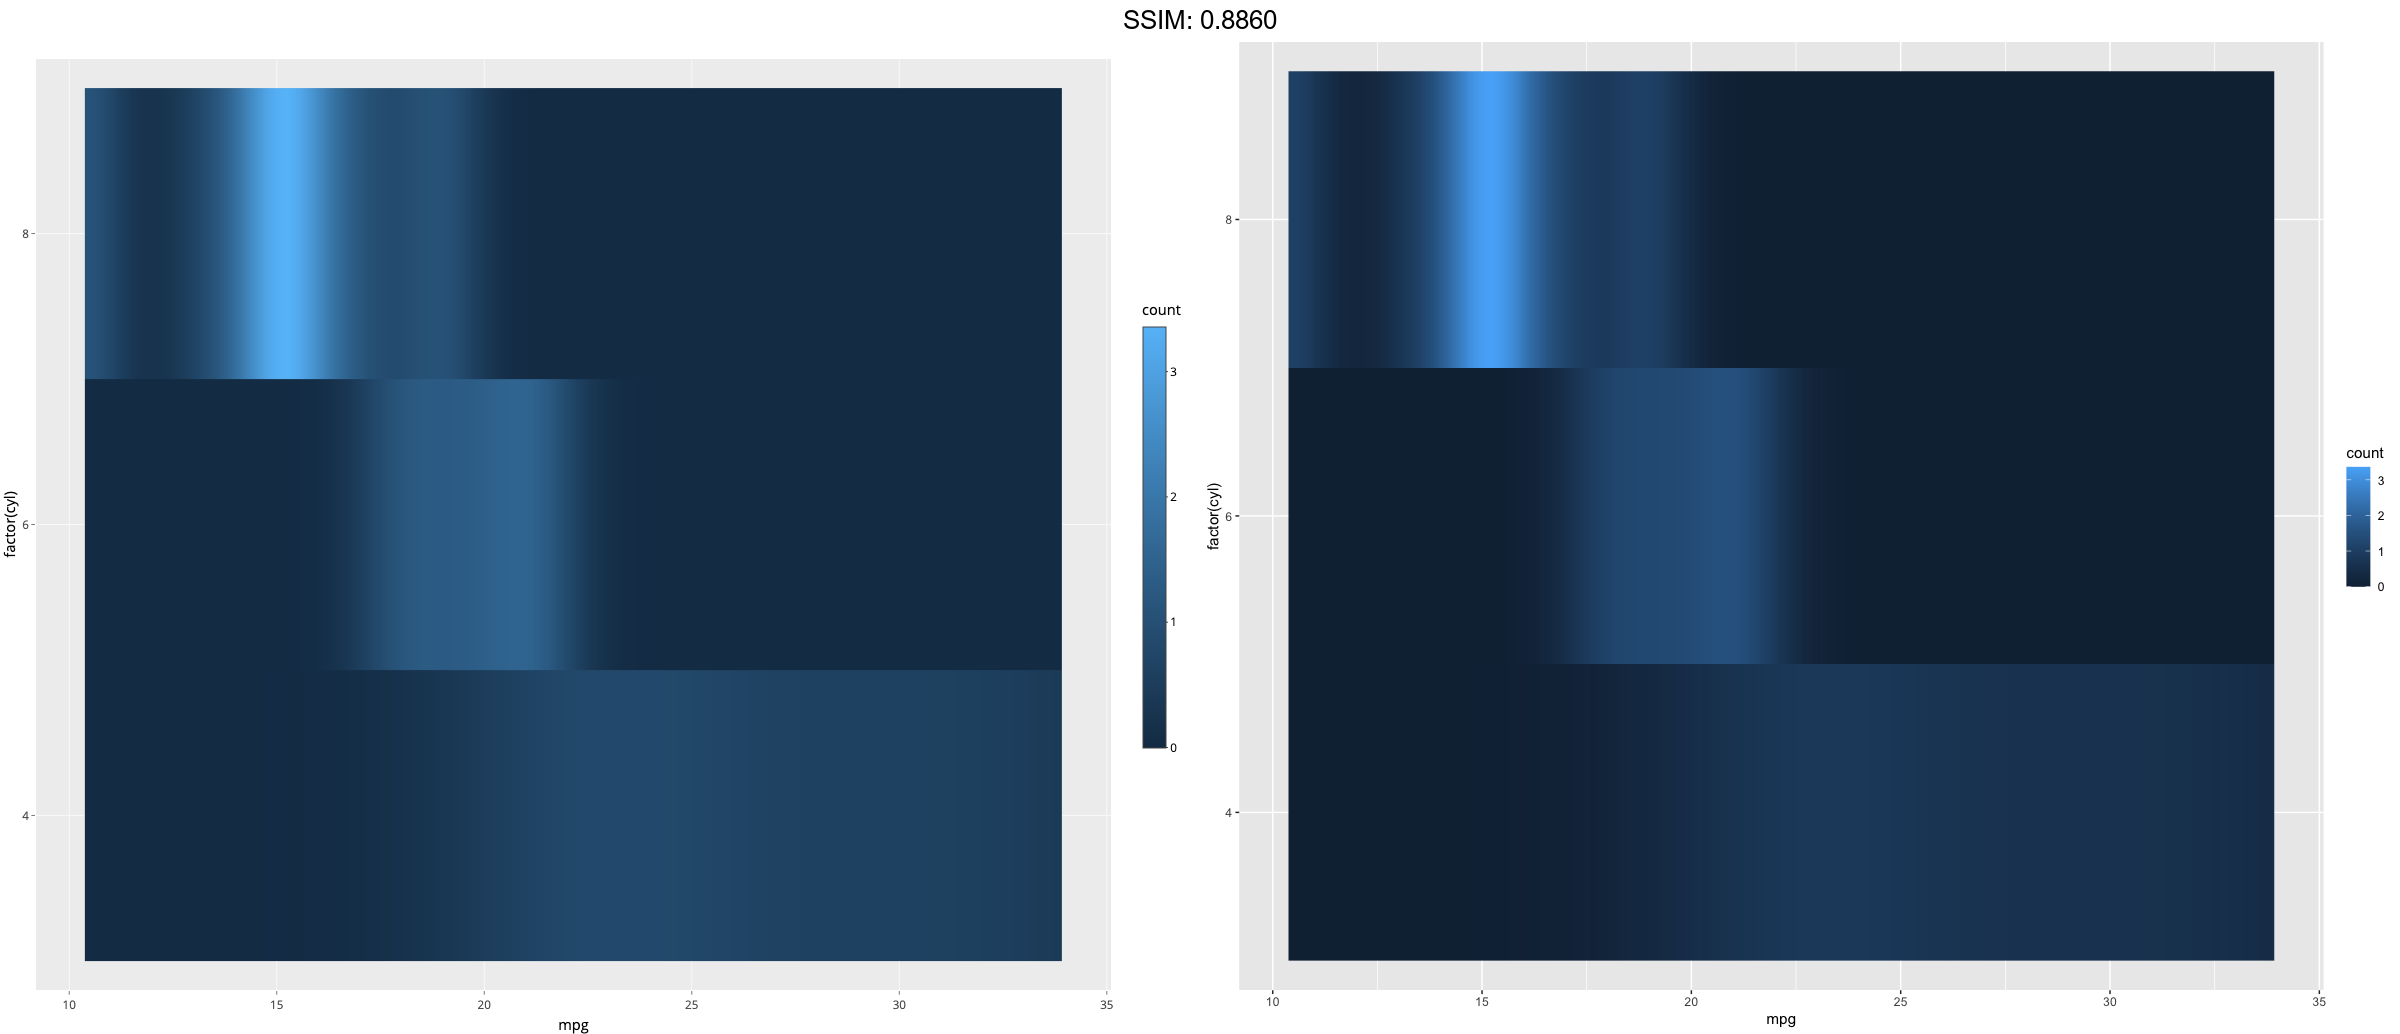
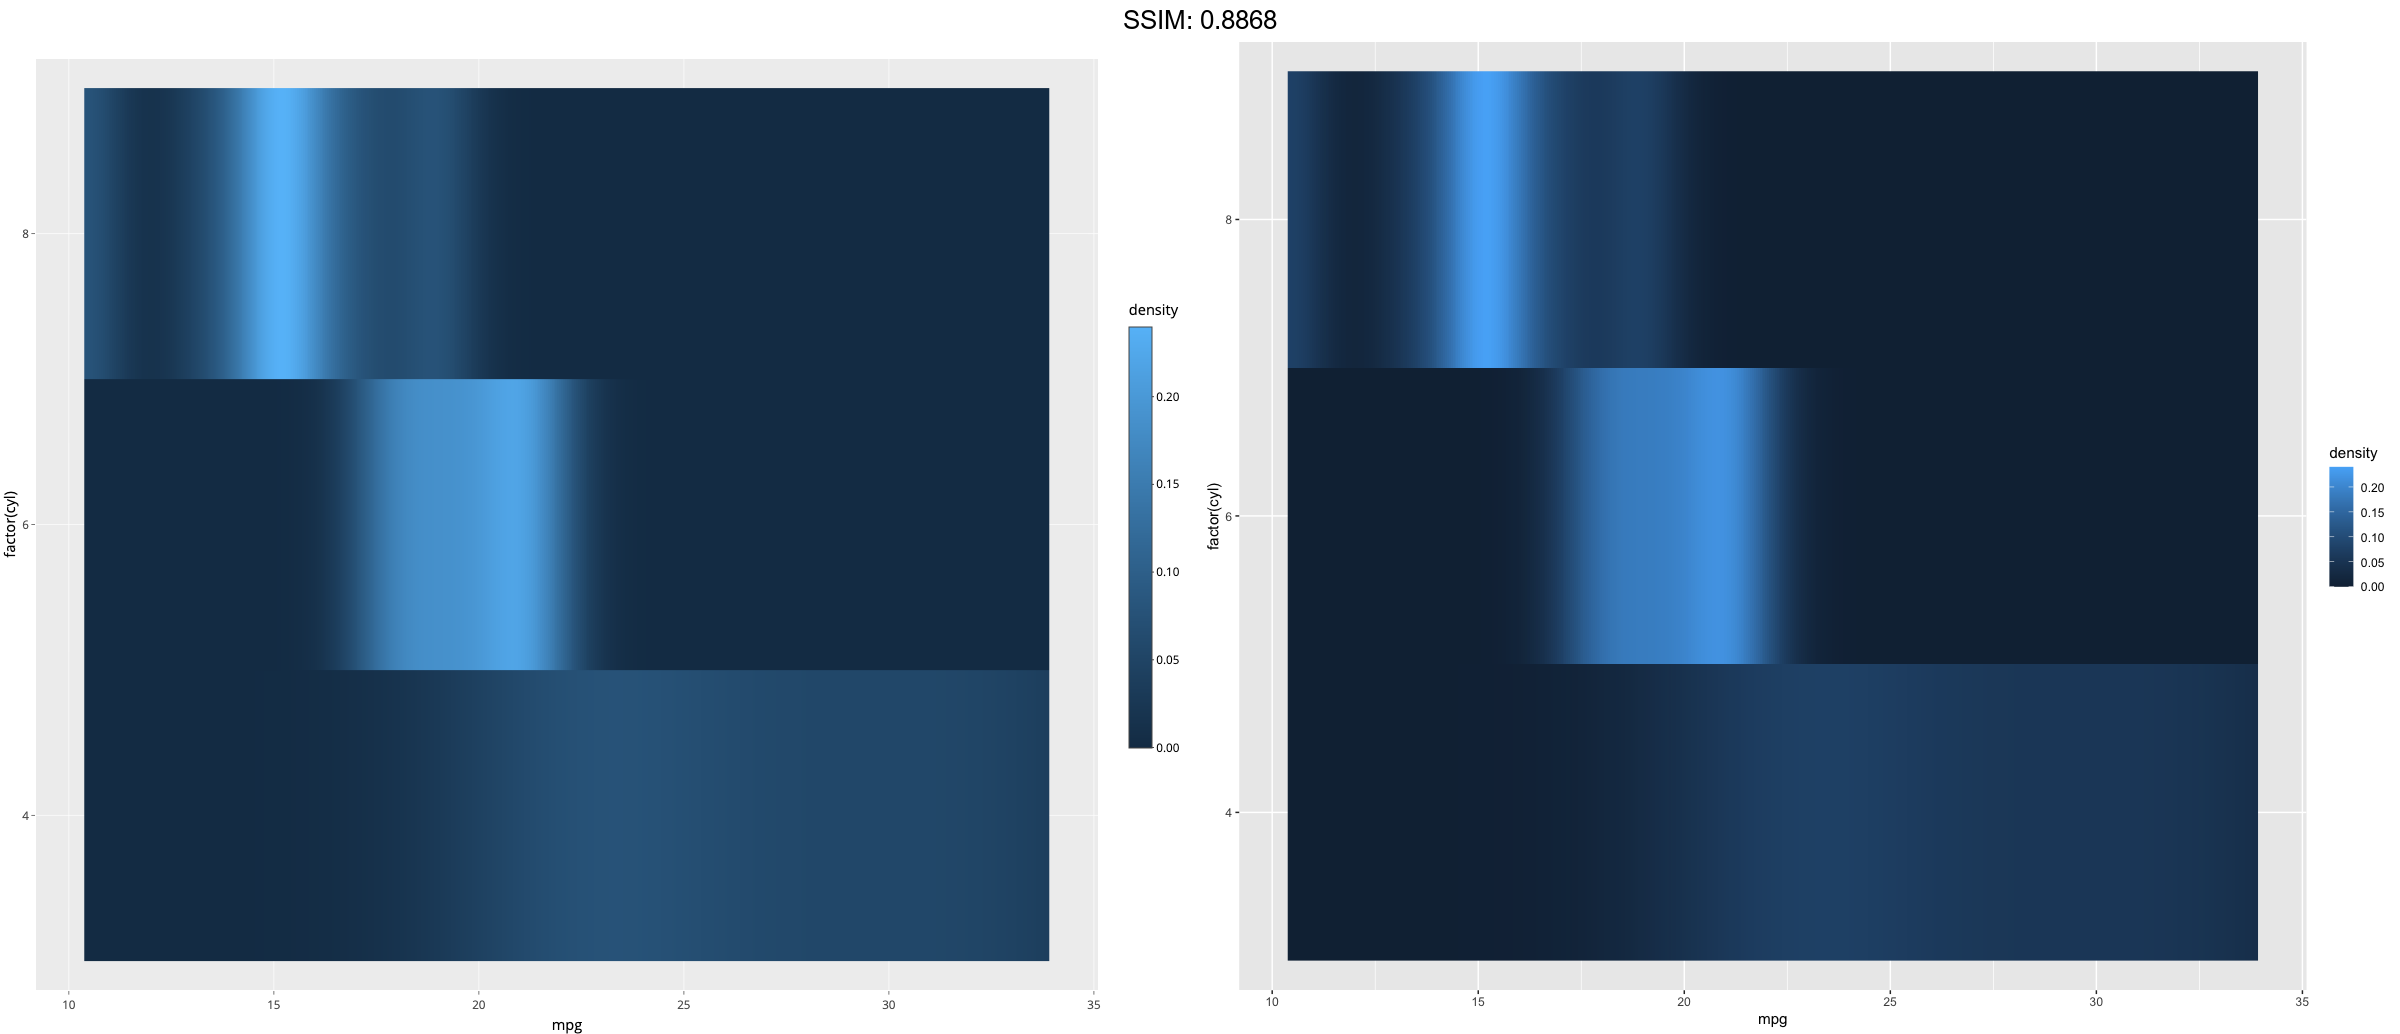
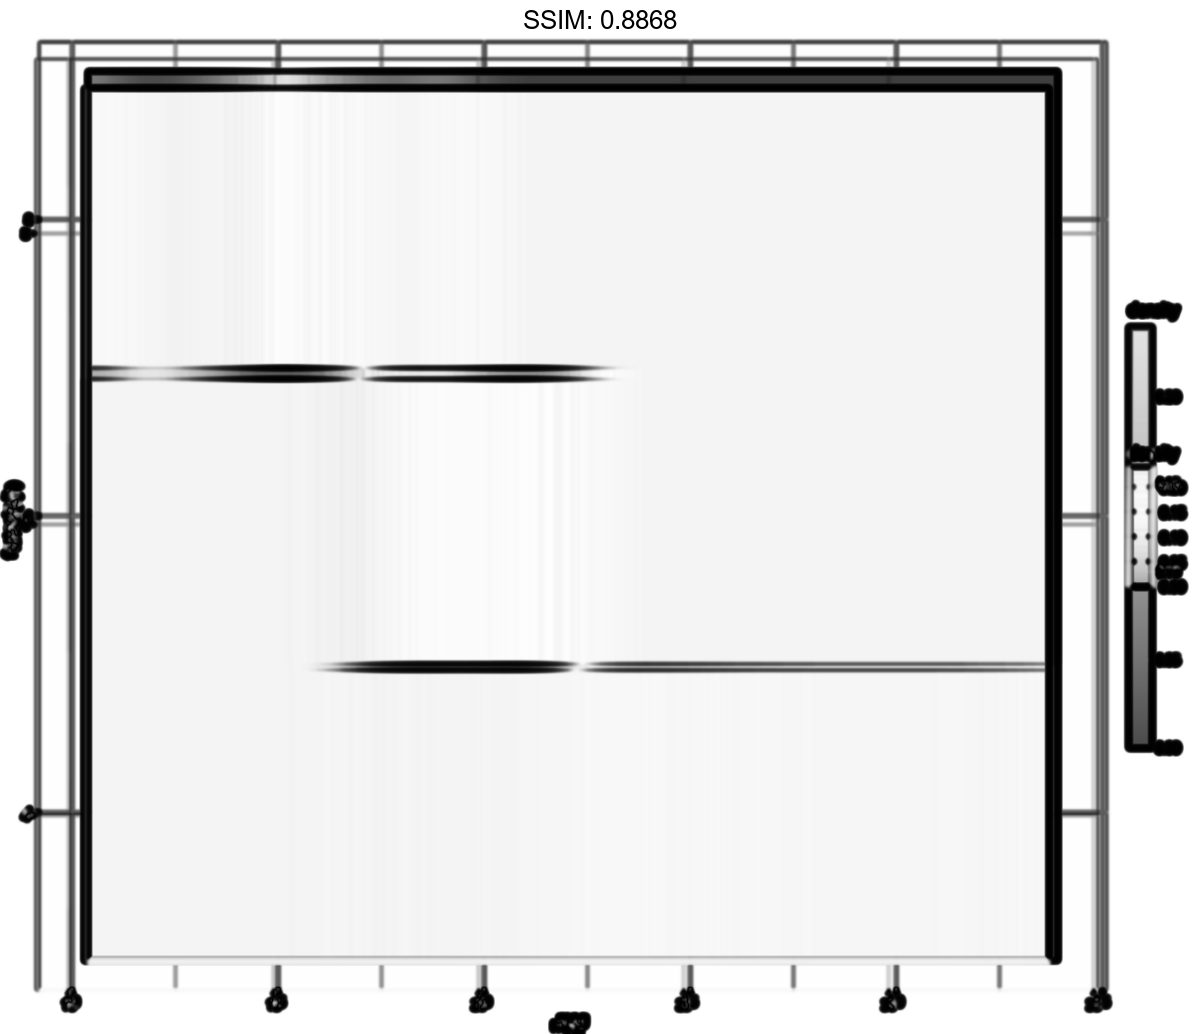
cars <- ggplot(mtcars, aes(mpg, factor(cyl)))
p <-
 cars +
  stat_density(
    aes(fill = after_stat(density)),
    geom = "raster",
    position = "identity"
   )
plotly::ggplotly(p)
cars <- ggplot(mtcars, aes(mpg, factor(cyl)))
p <-
 cars +
  stat_density(
    aes(fill = after_stat(count)),
    geom = "raster",
    position = "identity"
  )
plotly::ggplotly(p)