Edit chart
Loading graph
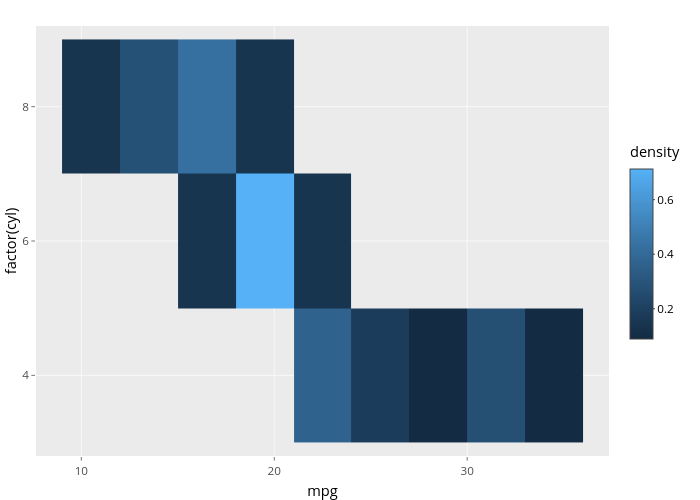
Nadhil3's interactive graph and data of "factor(cyl) vs mpg" is a heatmap, showing 99_35594b2b2aad0cf5c71f75ad2724c6dd; with mpg in the x-axis and factor(cyl) in the y-axis.. The x-axis shows values from 7.64999967 to 37.35000033. The y-axis shows values from 0.4 to 3.6.