Edit chart
Loading graph
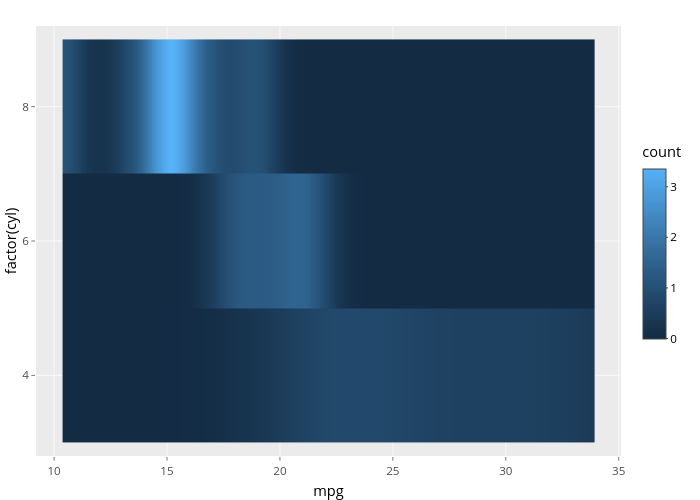
Nadhil3's interactive graph and data of "factor(cyl) vs mpg" is a heatmap, showing 99_8e1a608665e0cd5b78ea8ba2d5511280; with mpg in the x-axis and factor(cyl) in the y-axis.. The x-axis shows values from 9.19970645792564 to 35.1002935420744. The y-axis shows values from 0.4 to 3.6.