Edit chart
Loading graph
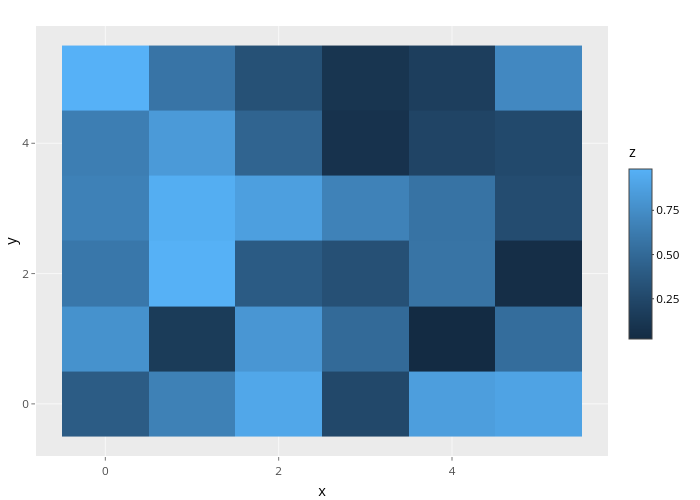
Nadhil3's interactive graph and data of "y vs x" is a heatmap, showing 99_e7ed57b31e5a02655827e23ed38b3a86; with x in the x-axis and y in the y-axis.. The x-axis shows values from -0.8 to 5.8. The y-axis shows values from -0.8 to 5.8.