Edit chart
Loading graph
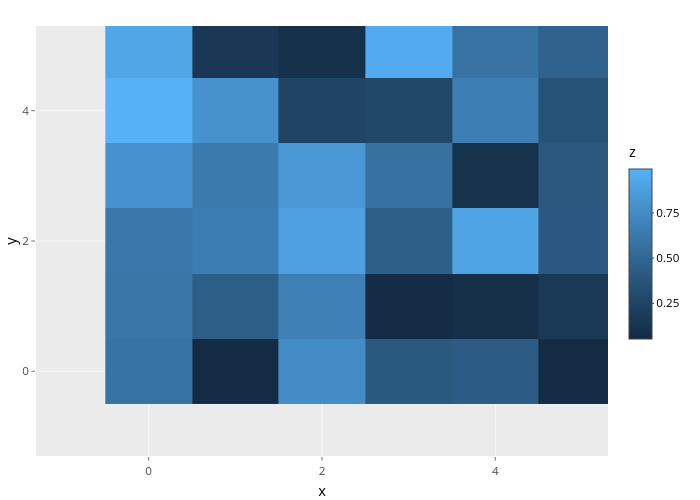
Nadhil3's interactive graph and data of "y vs x" is a heatmap, showing 99_9eea7ce3ab8168534fbf164e49c66ba0; with x in the x-axis and y in the y-axis.. The x-axis shows values from -1.3 to 5.3. The y-axis shows values from -1.3 to 5.3.