GGPLOT - aes_colour_fill_alpha
Change the colour (colour and fill) and the opacity (alpha) of geom elements on a plot and then convert them with ggplotly
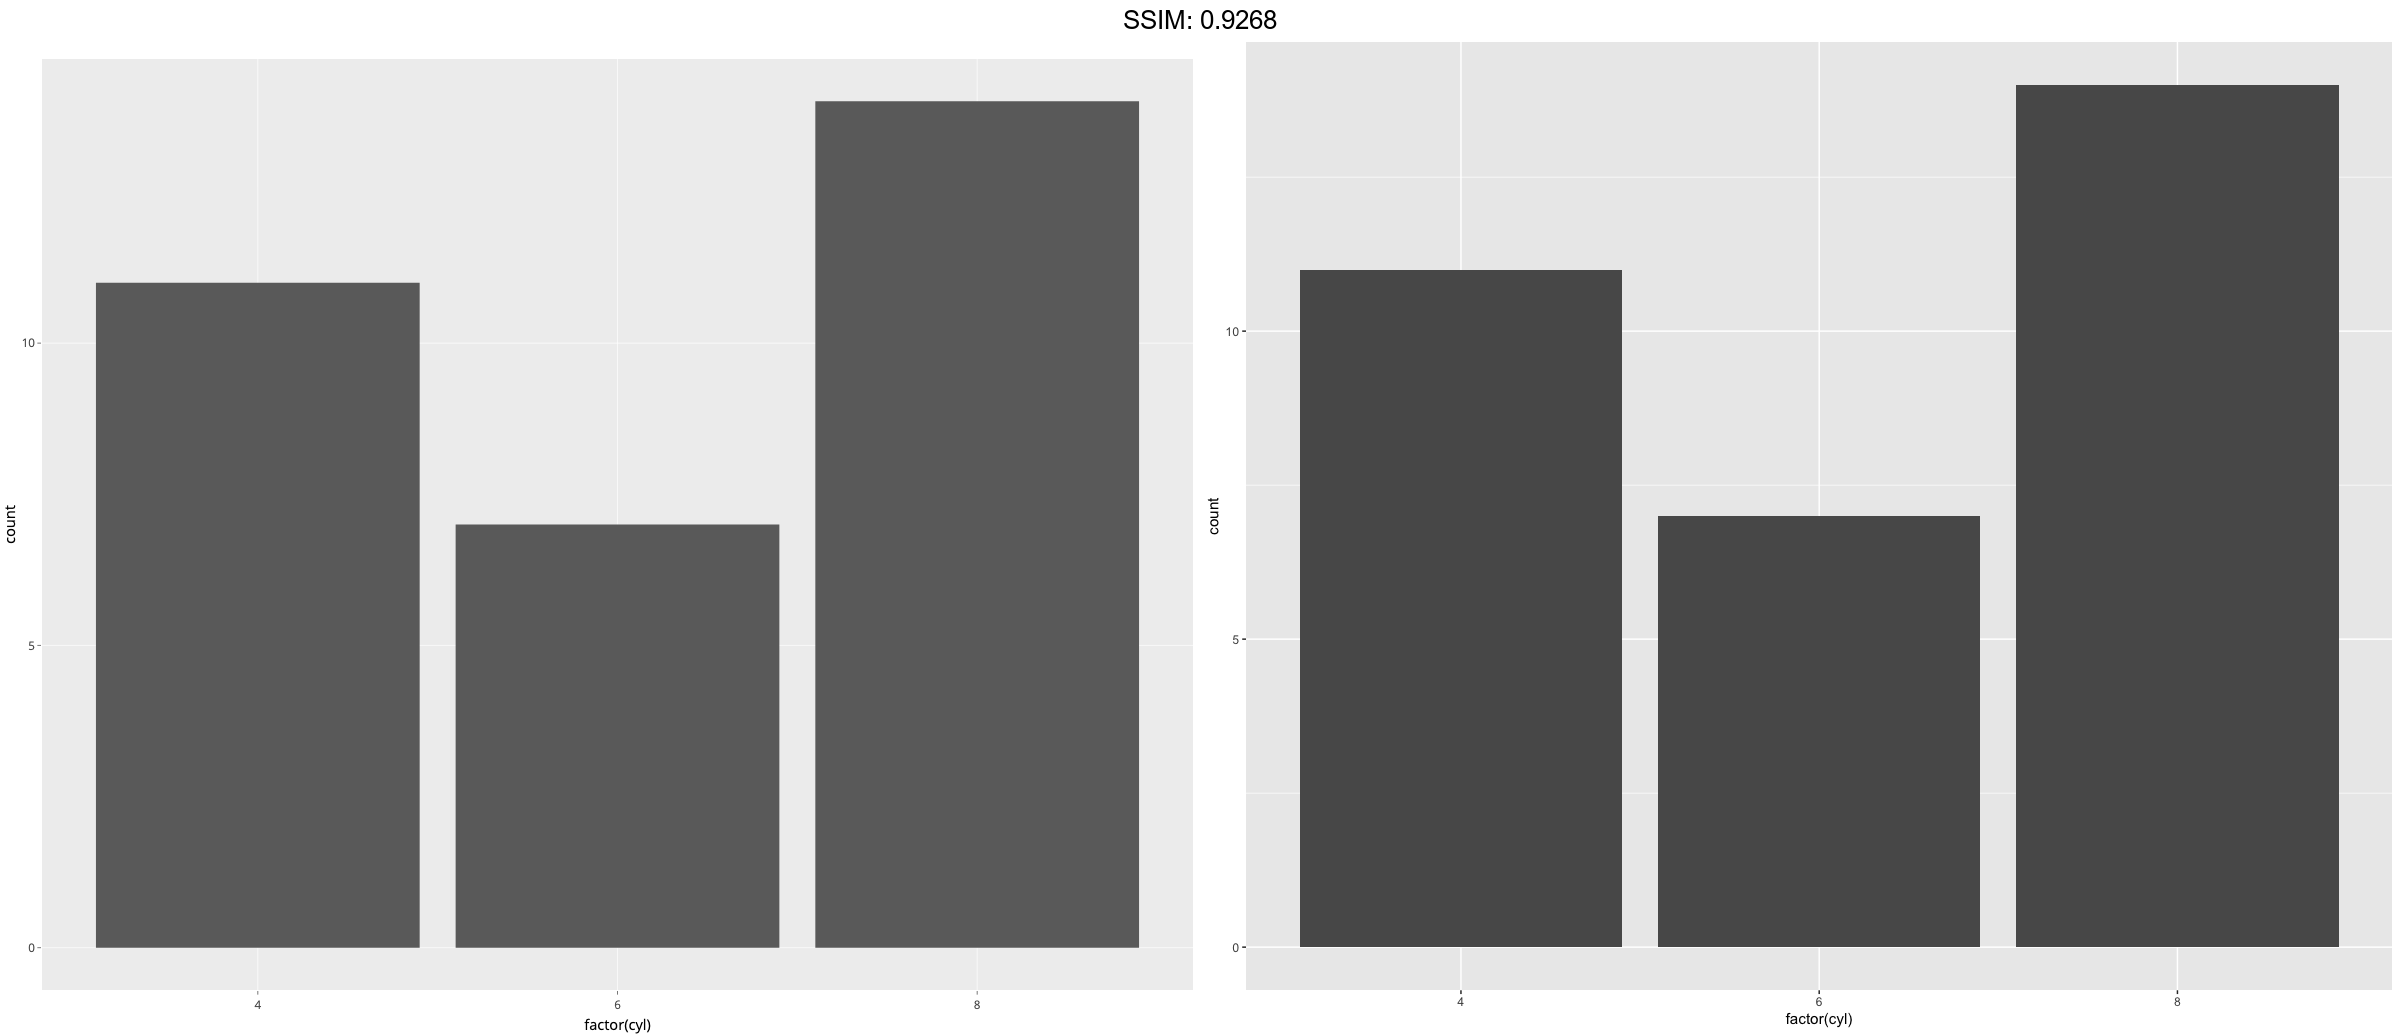
p <- ggplot(mtcars, aes(factor(cyl)))
p <-  p + geom_bar()
plotly::ggplotly(p)


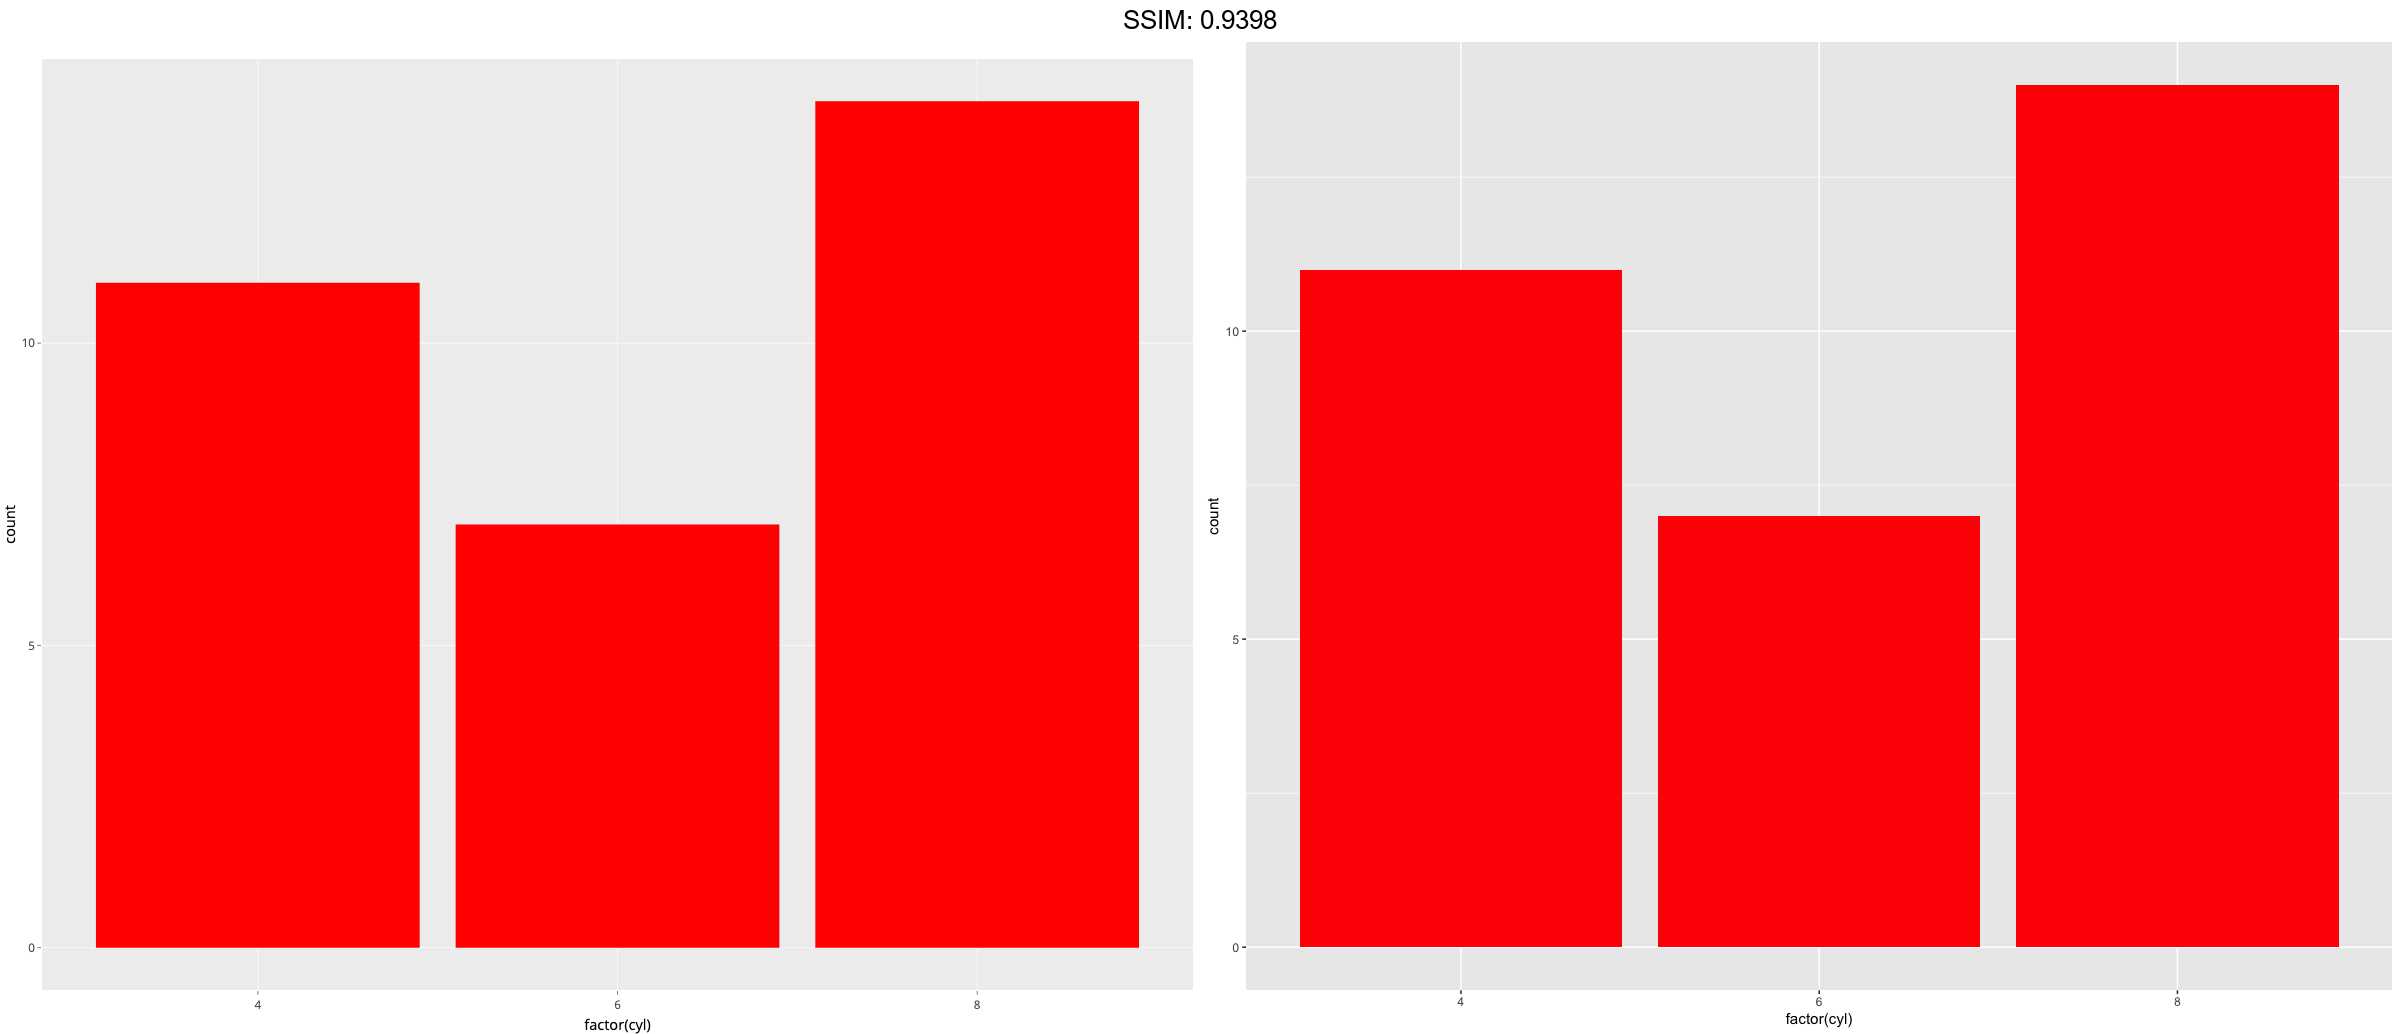
p <- ggplot(mtcars, aes(factor(cyl)))
p <-  p + geom_bar(fill = "red")
plotly::ggplotly(p)

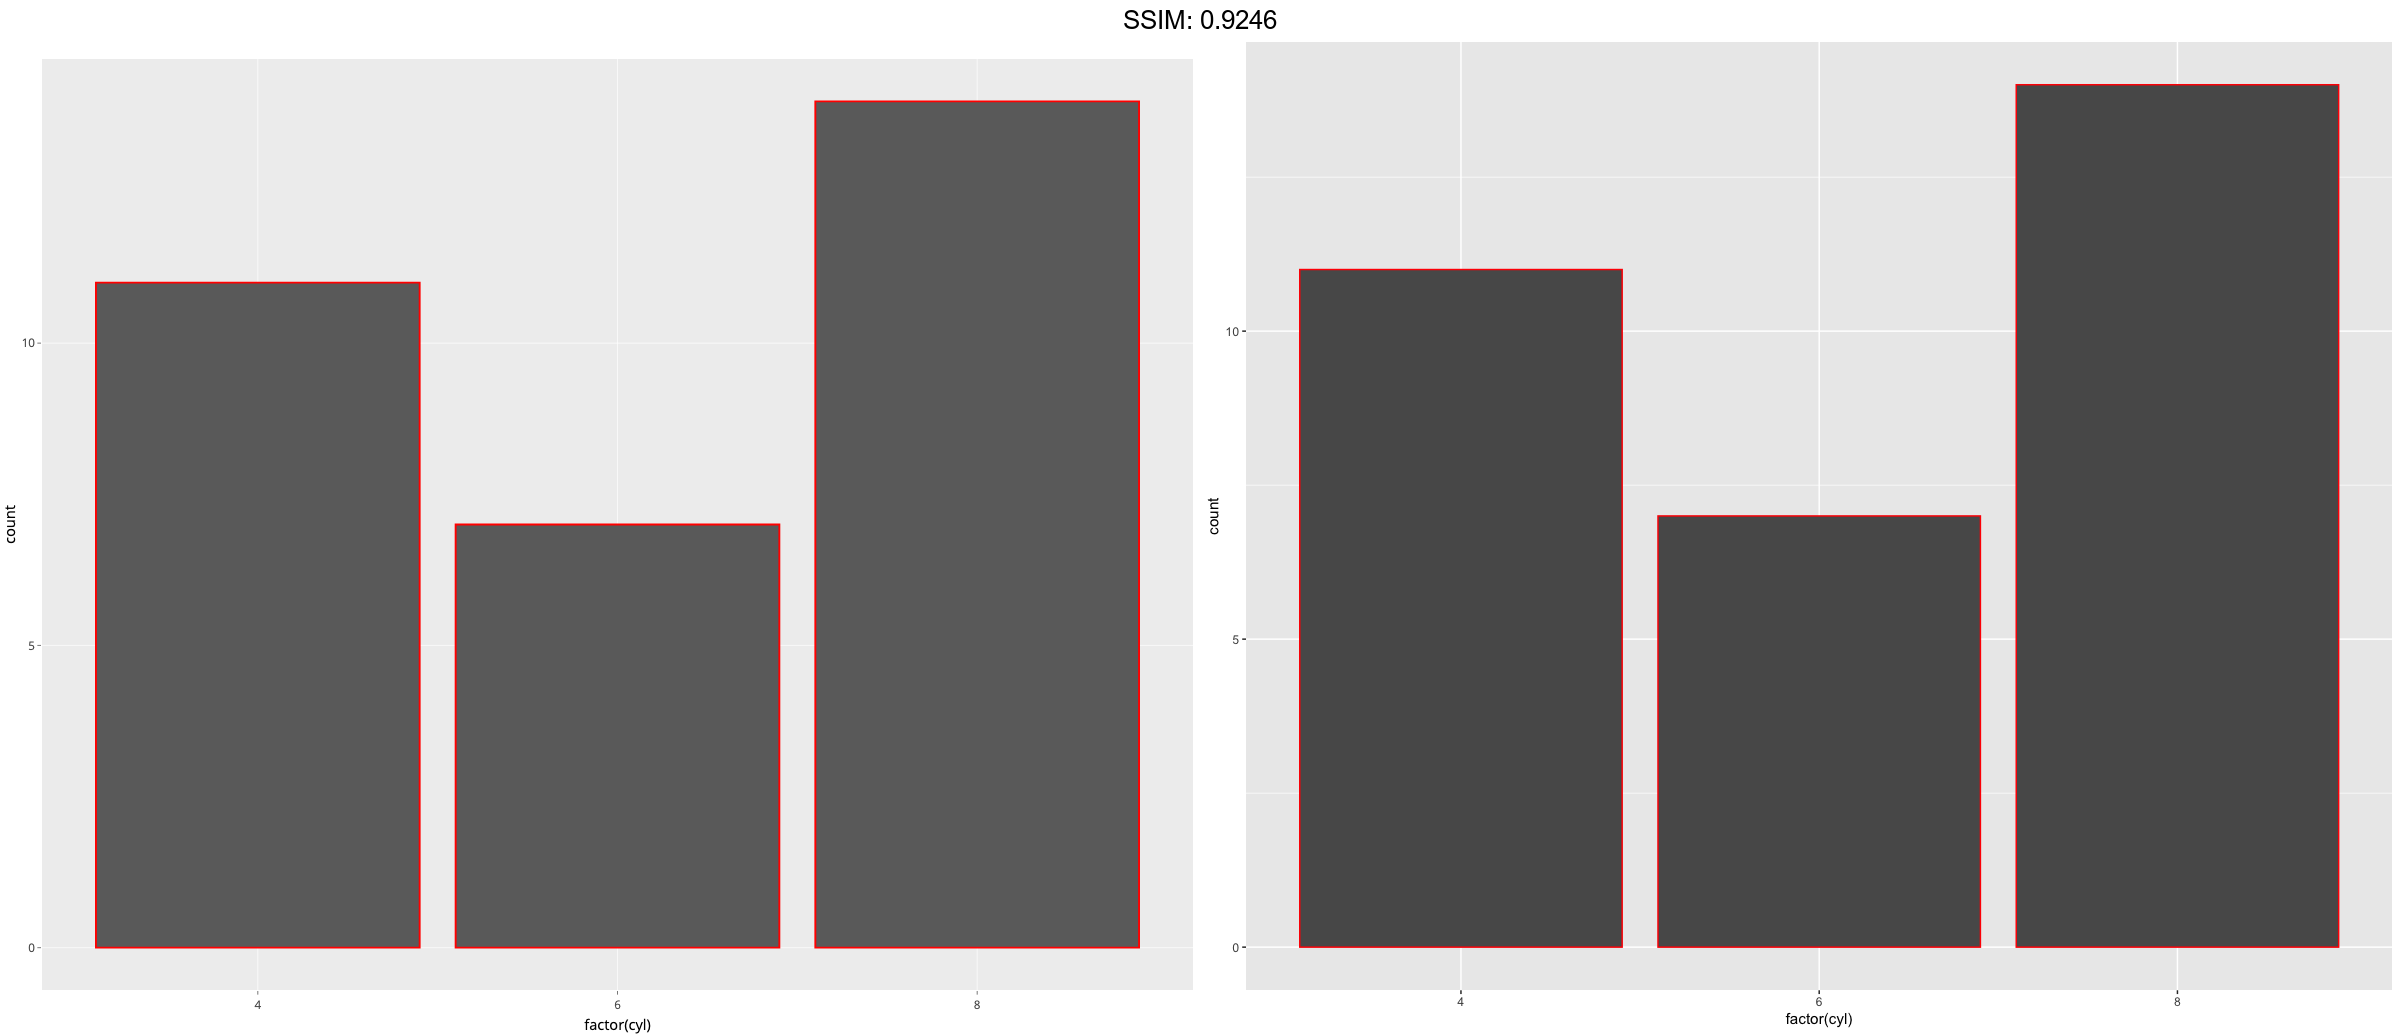
p <- ggplot(mtcars, aes(factor(cyl)))
p <-  p + geom_bar(colour = "red")
plotly::ggplotly(p)
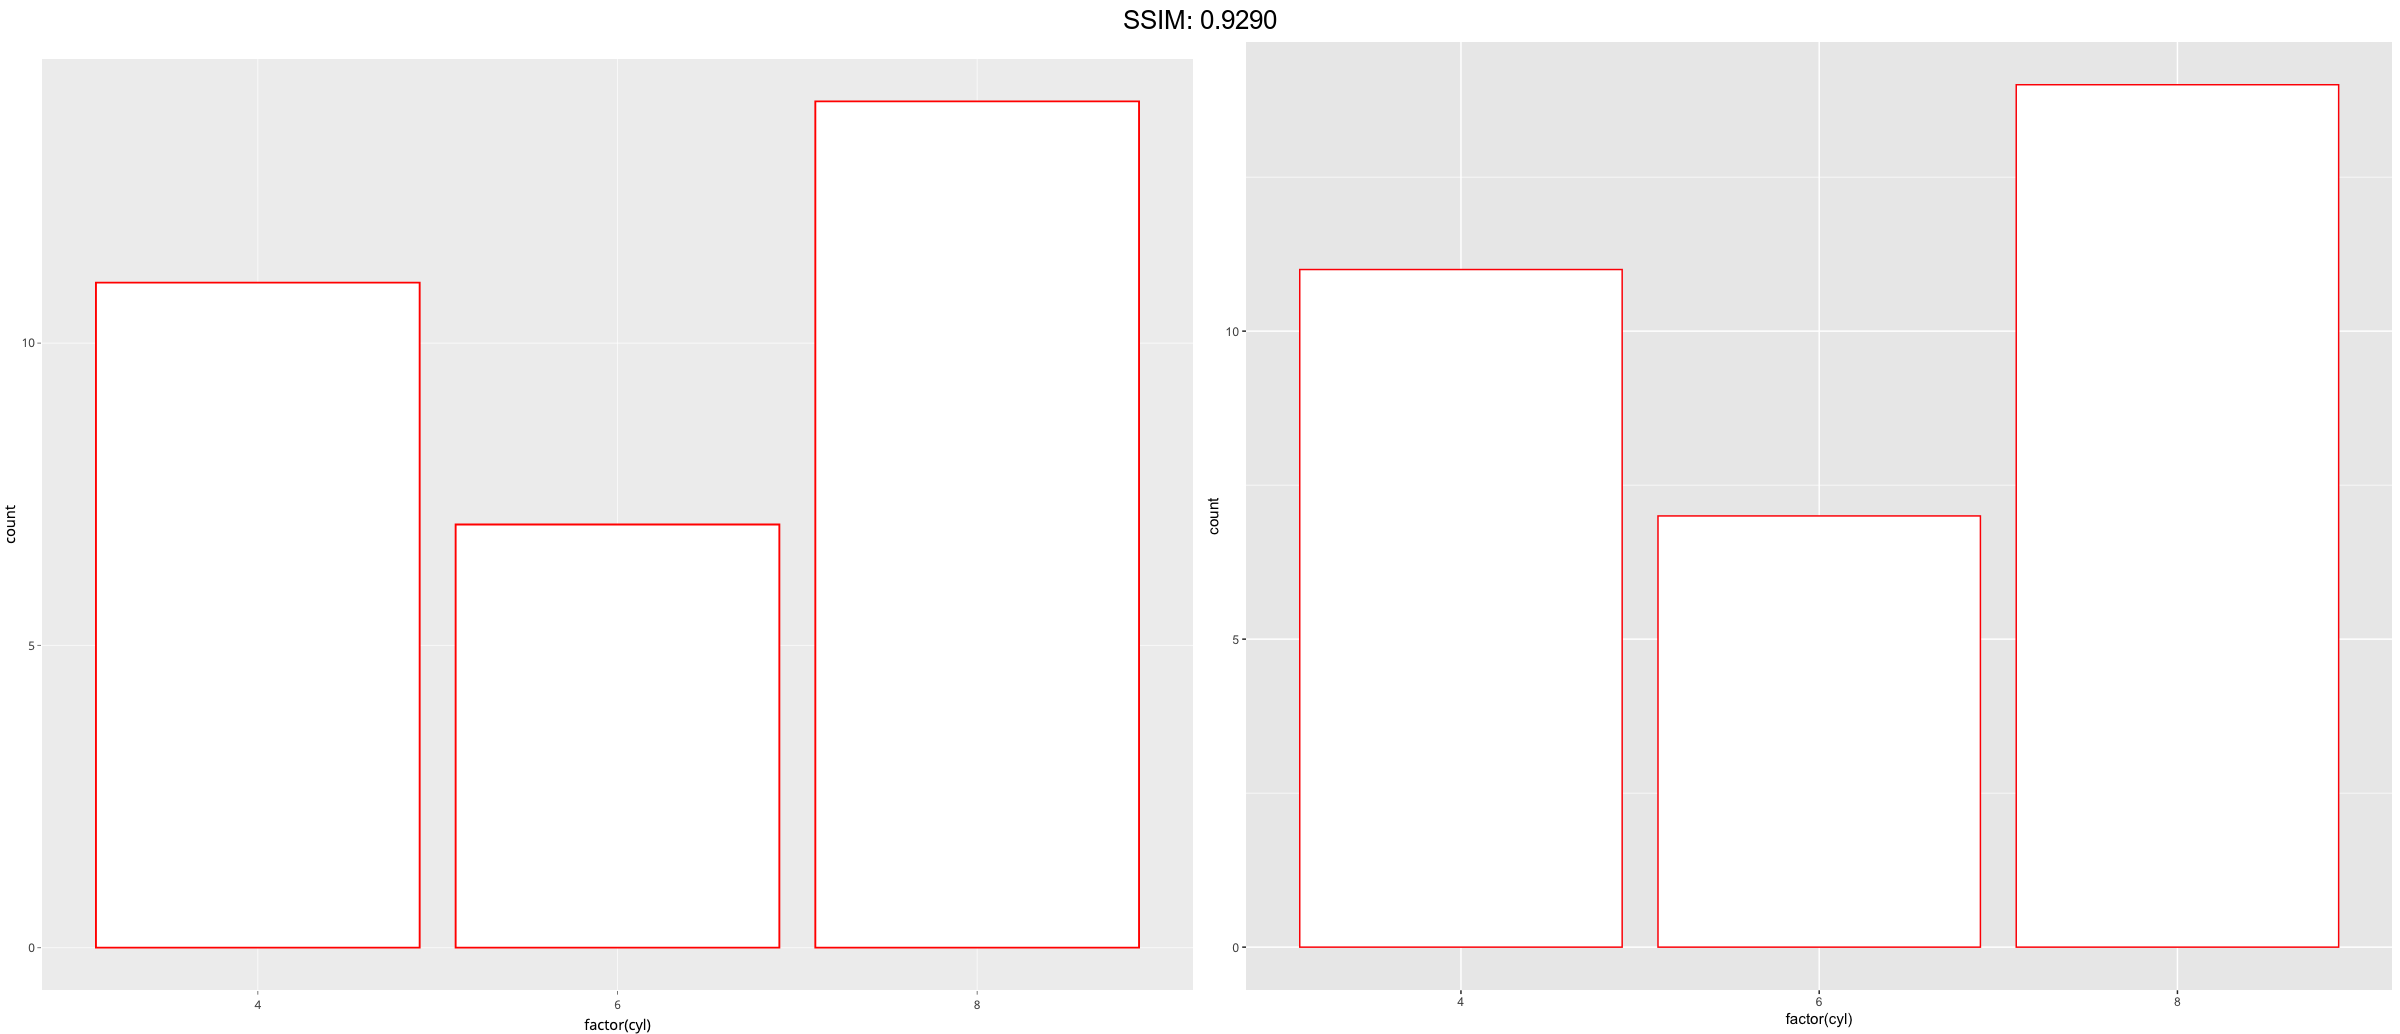
p <- ggplot(mtcars, aes(factor(cyl)))
p <-  p + geom_bar(fill = "white", colour = "red")
plotly::ggplotly(p)
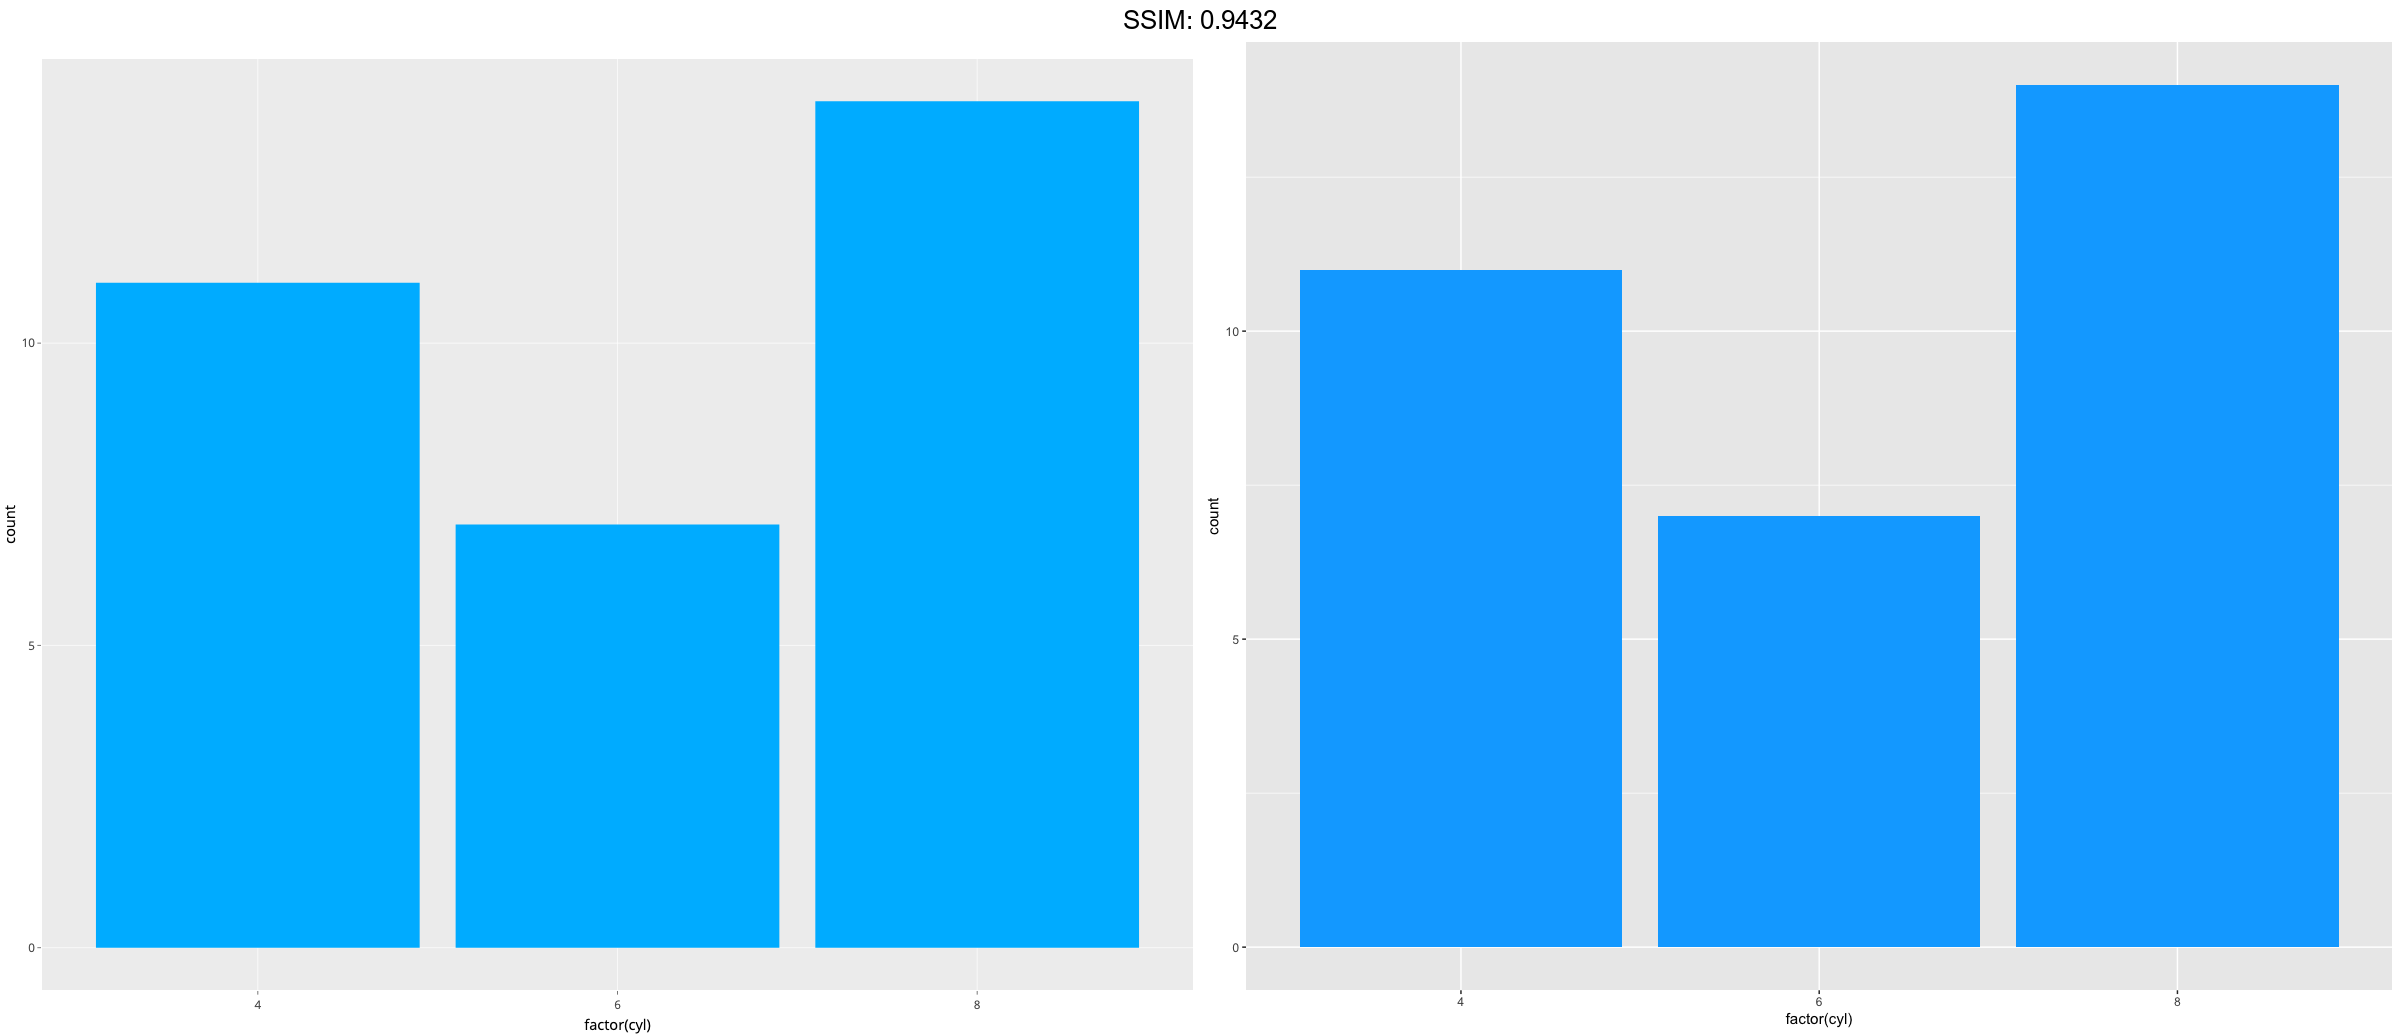
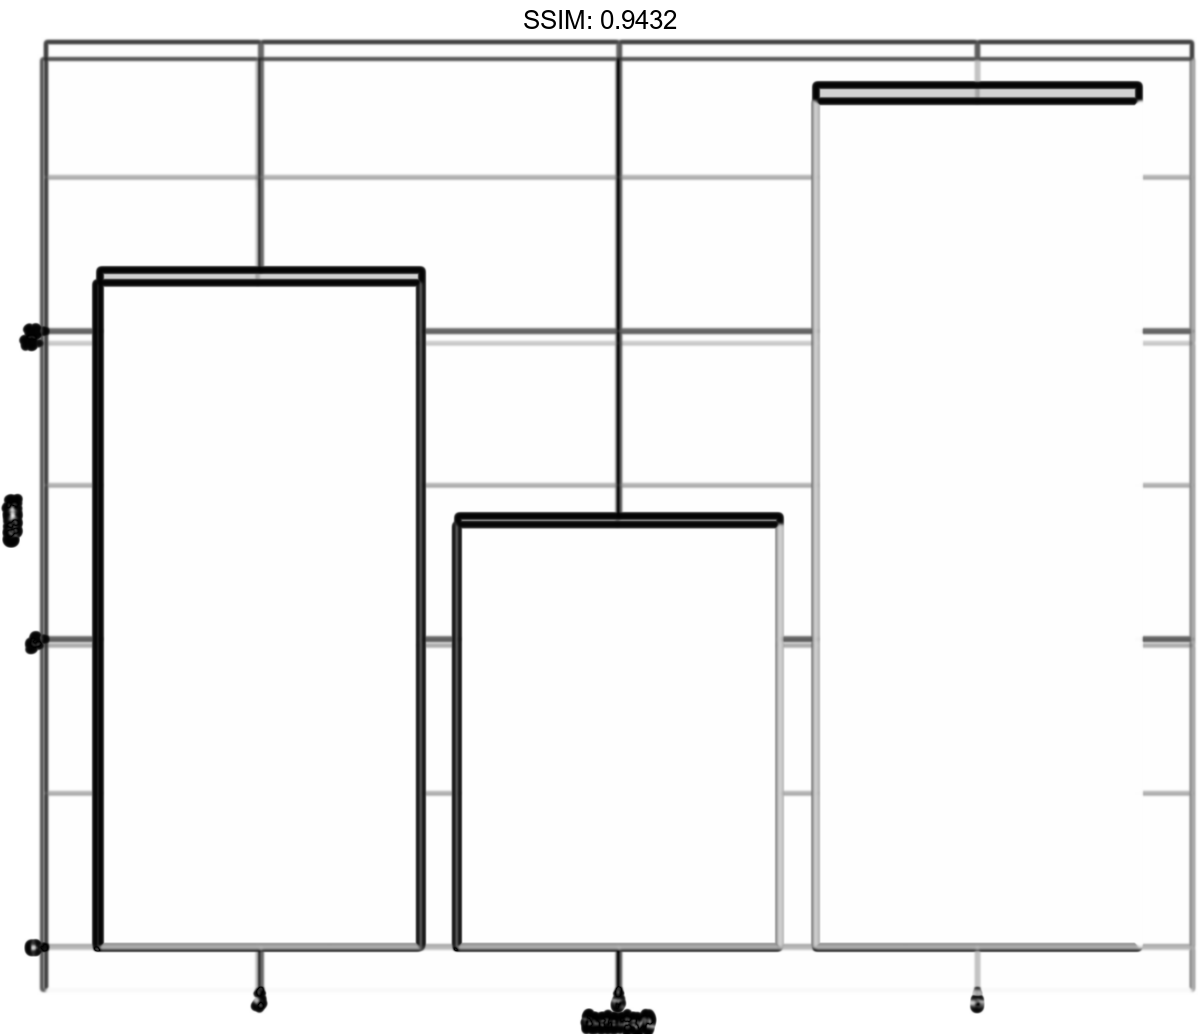
p <- ggplot(mtcars, aes(factor(cyl)))
p <-  p + geom_bar(fill = "#00abff")
plotly::ggplotly(p)
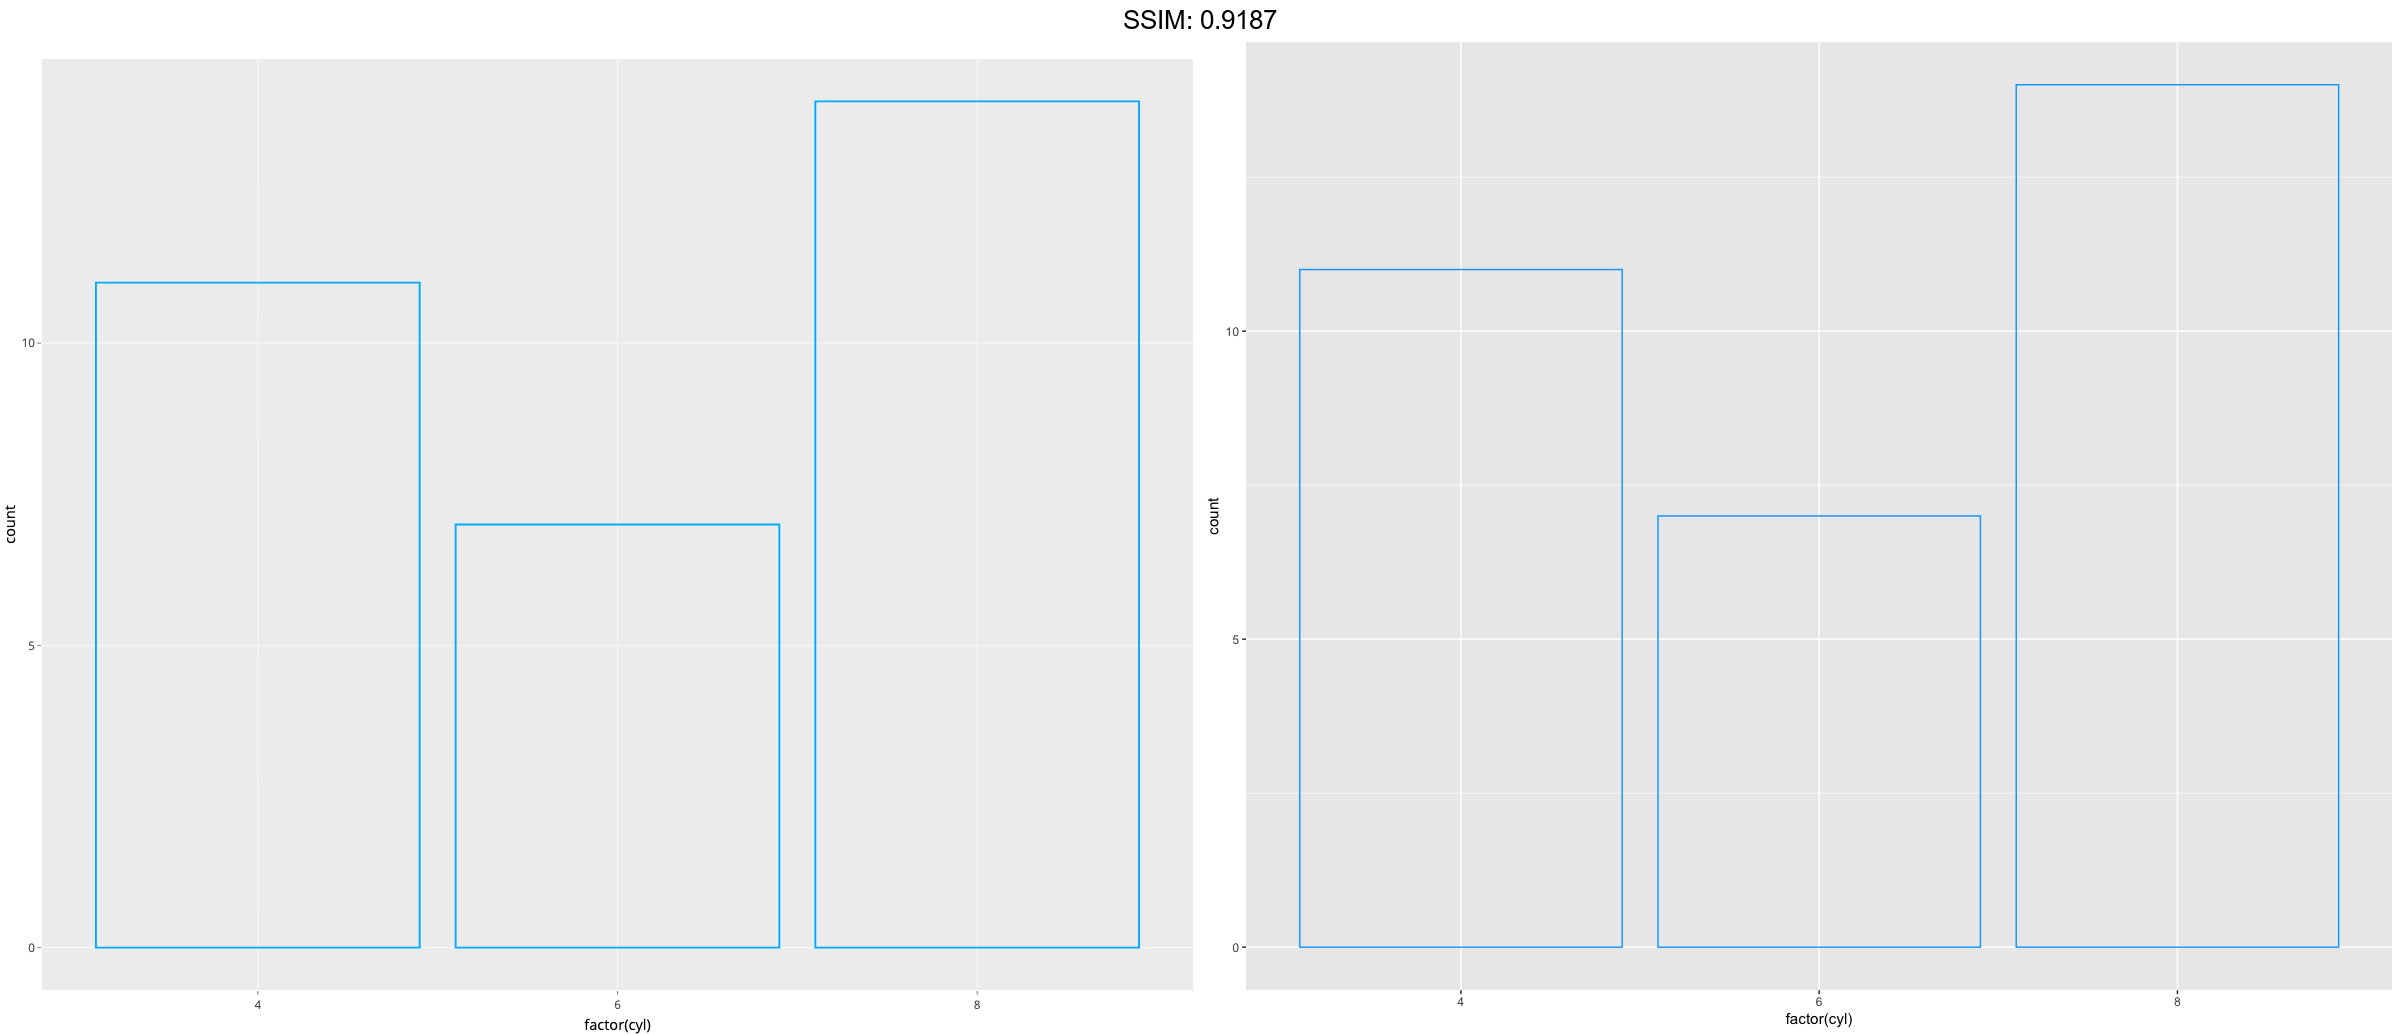
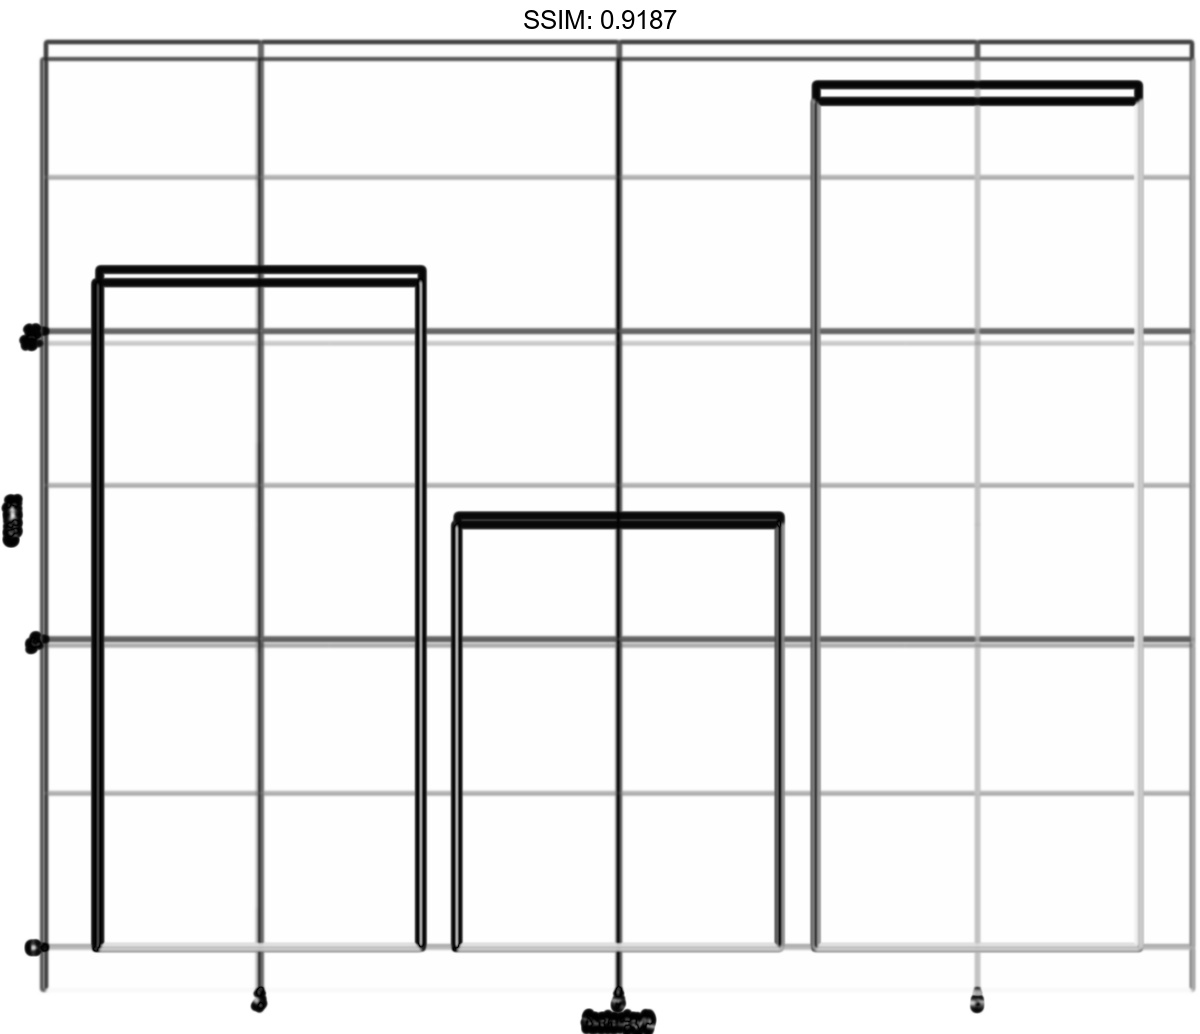
p <- ggplot(mtcars, aes(factor(cyl)))
p <-  p + geom_bar(fill = NA, colour = "#00abff")
plotly::ggplotly(p)
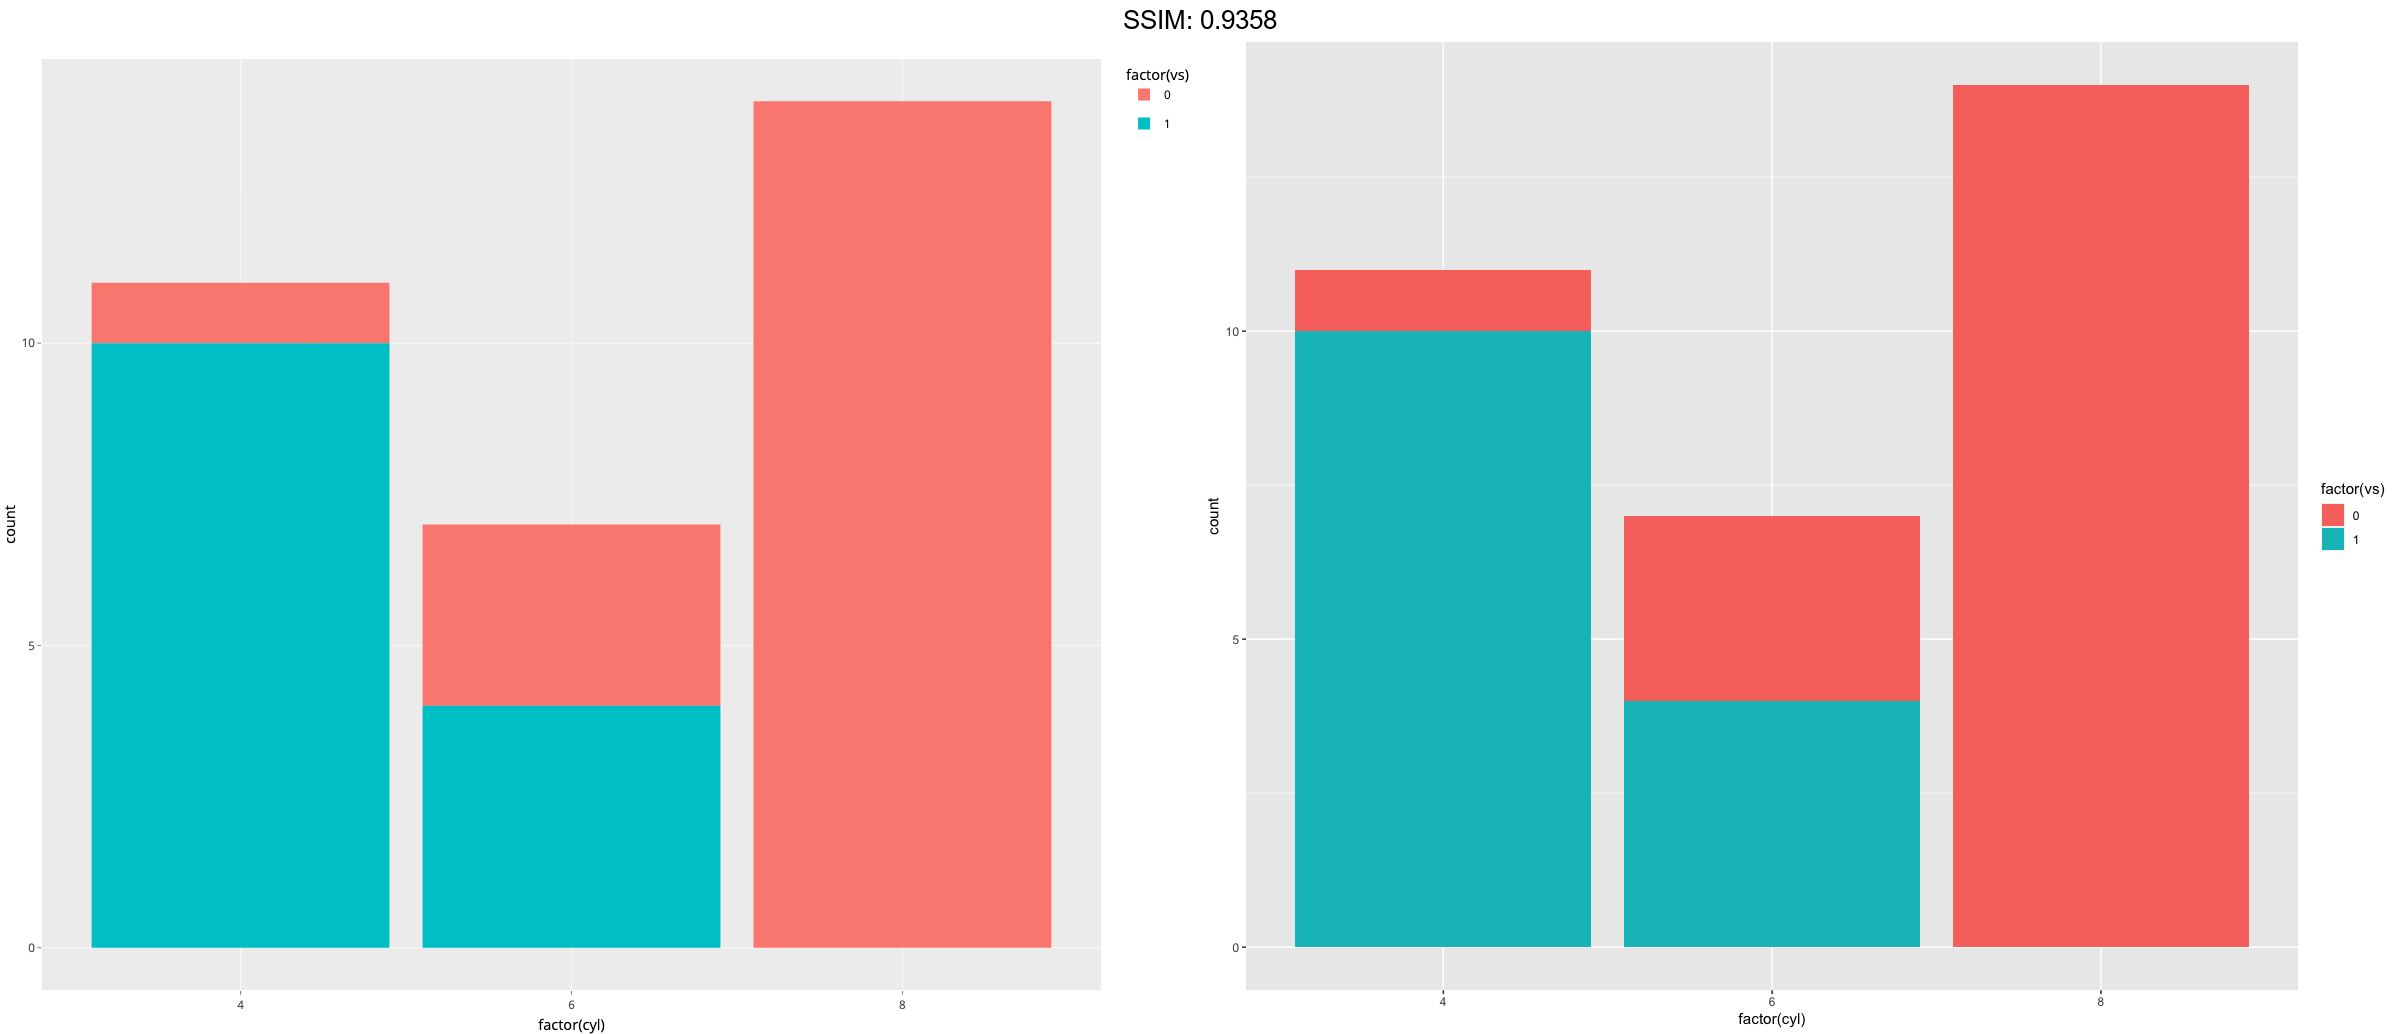
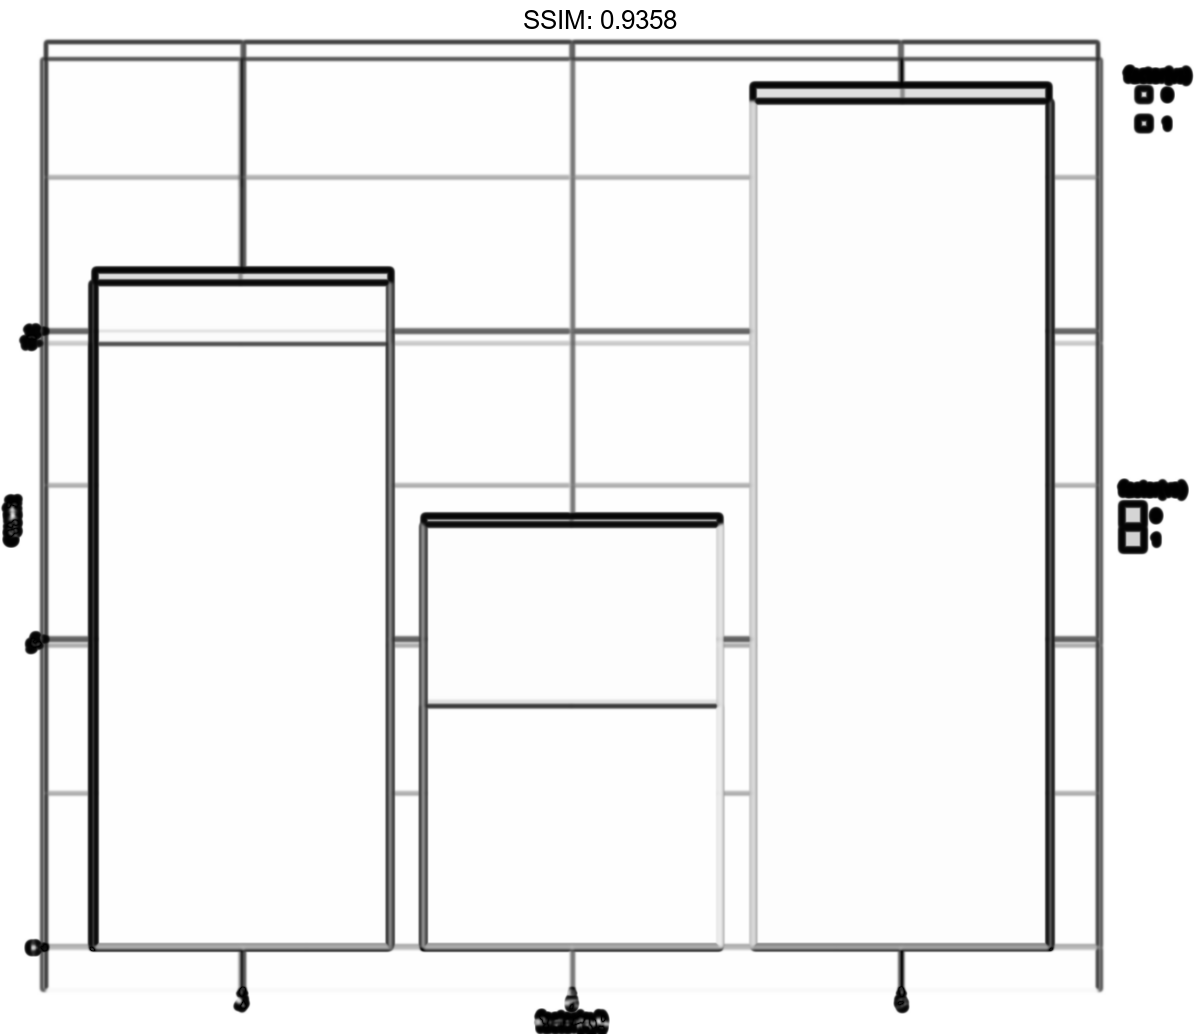
p <- ggplot(mtcars, aes(factor(cyl), fill = factor(vs))) + geom_bar()
plotly::ggplotly(p)
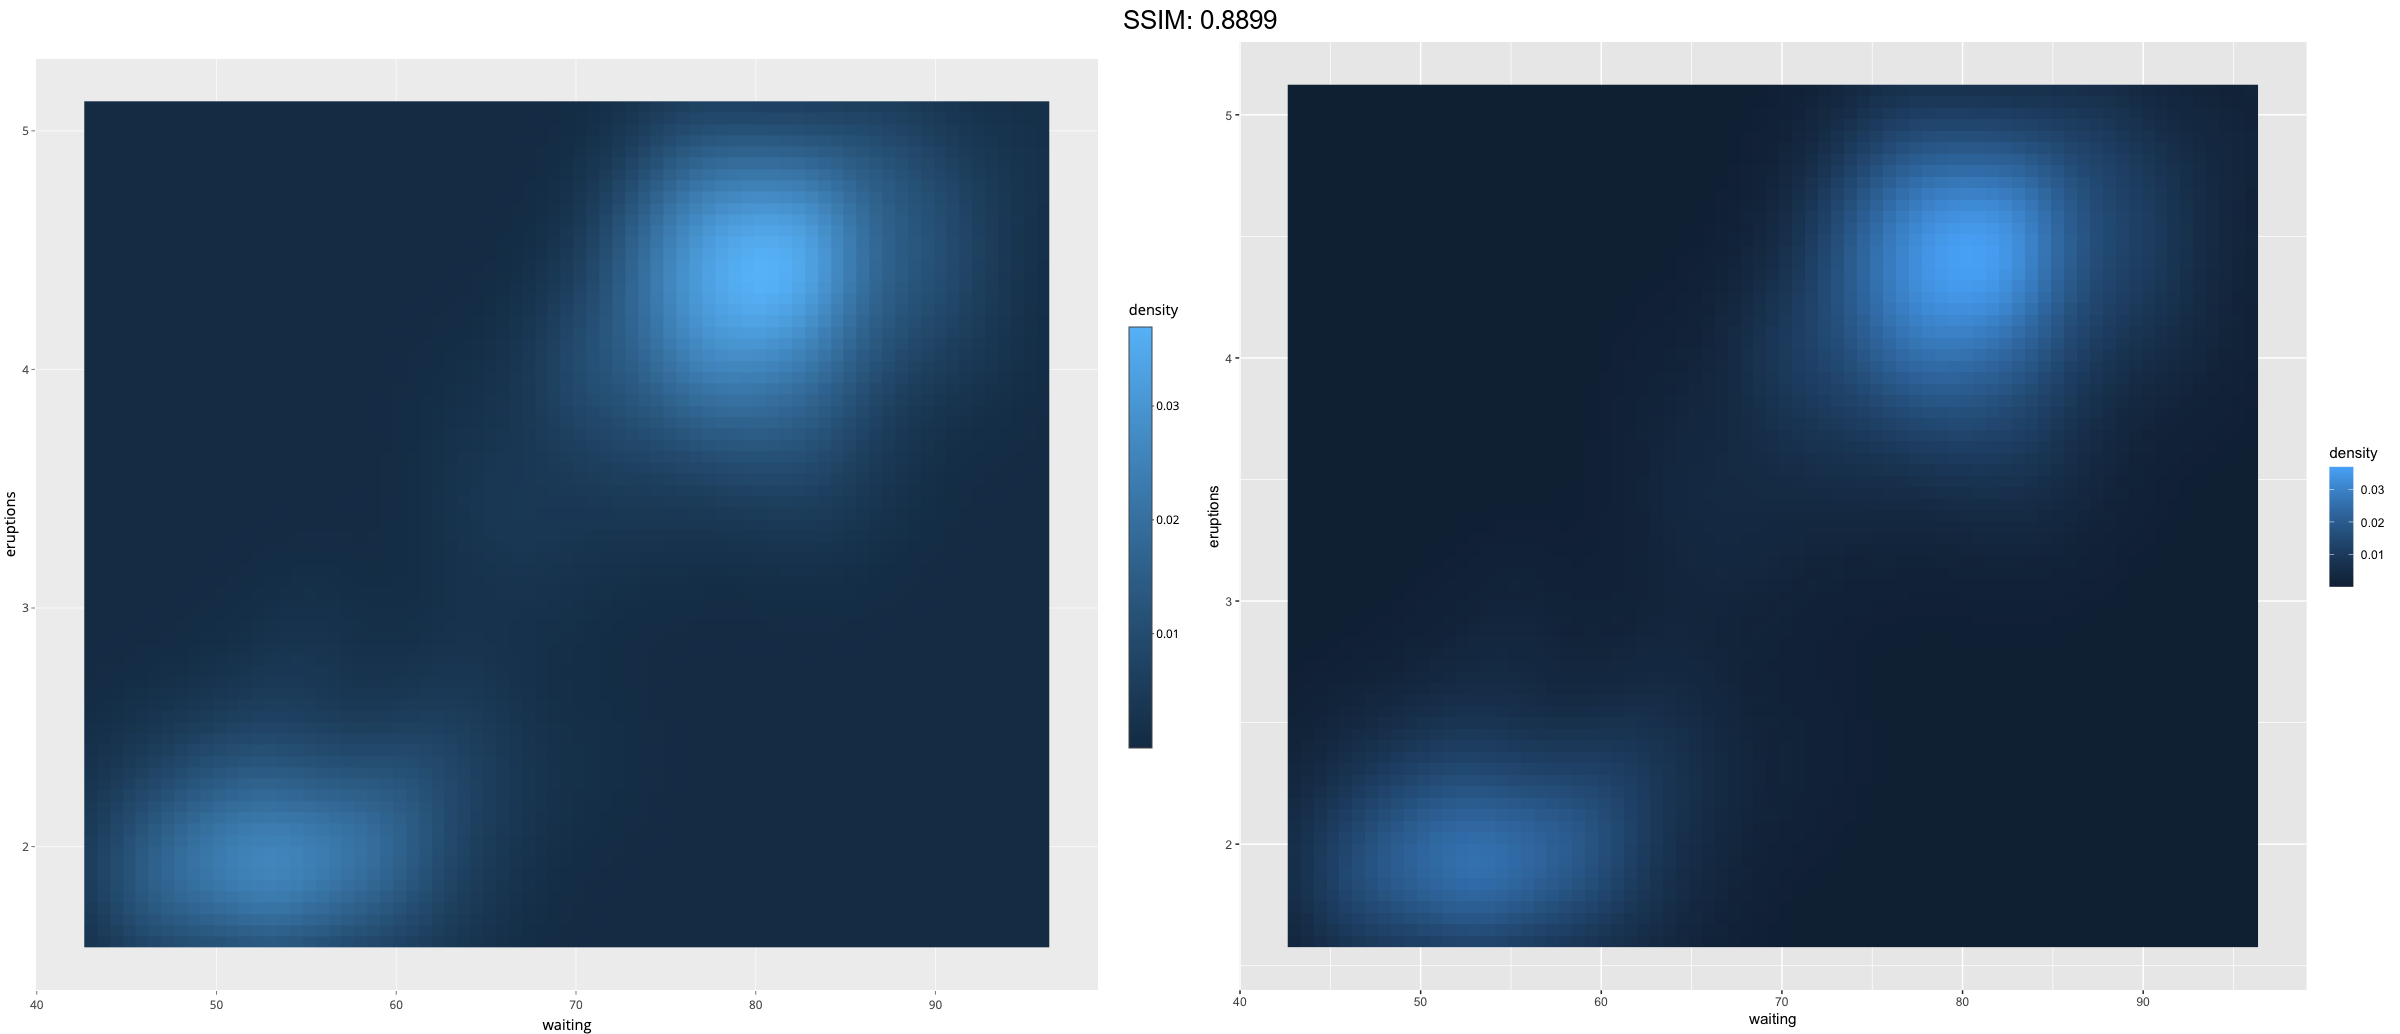
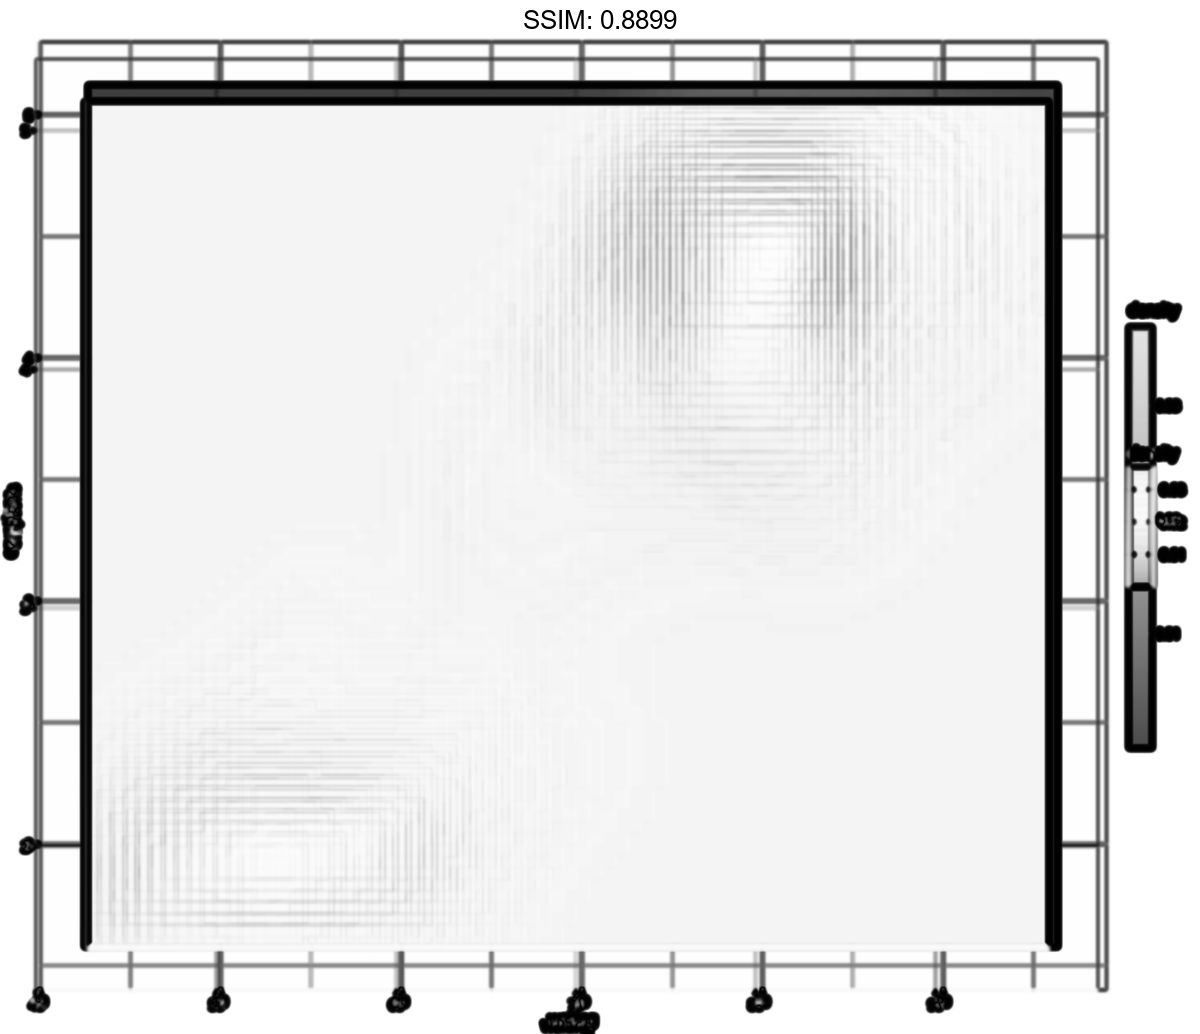
p <-
 ggplot(faithfuld, aes(waiting, eruptions)) +
  geom_raster(aes(fill = density))
plotly::ggplotly(p)
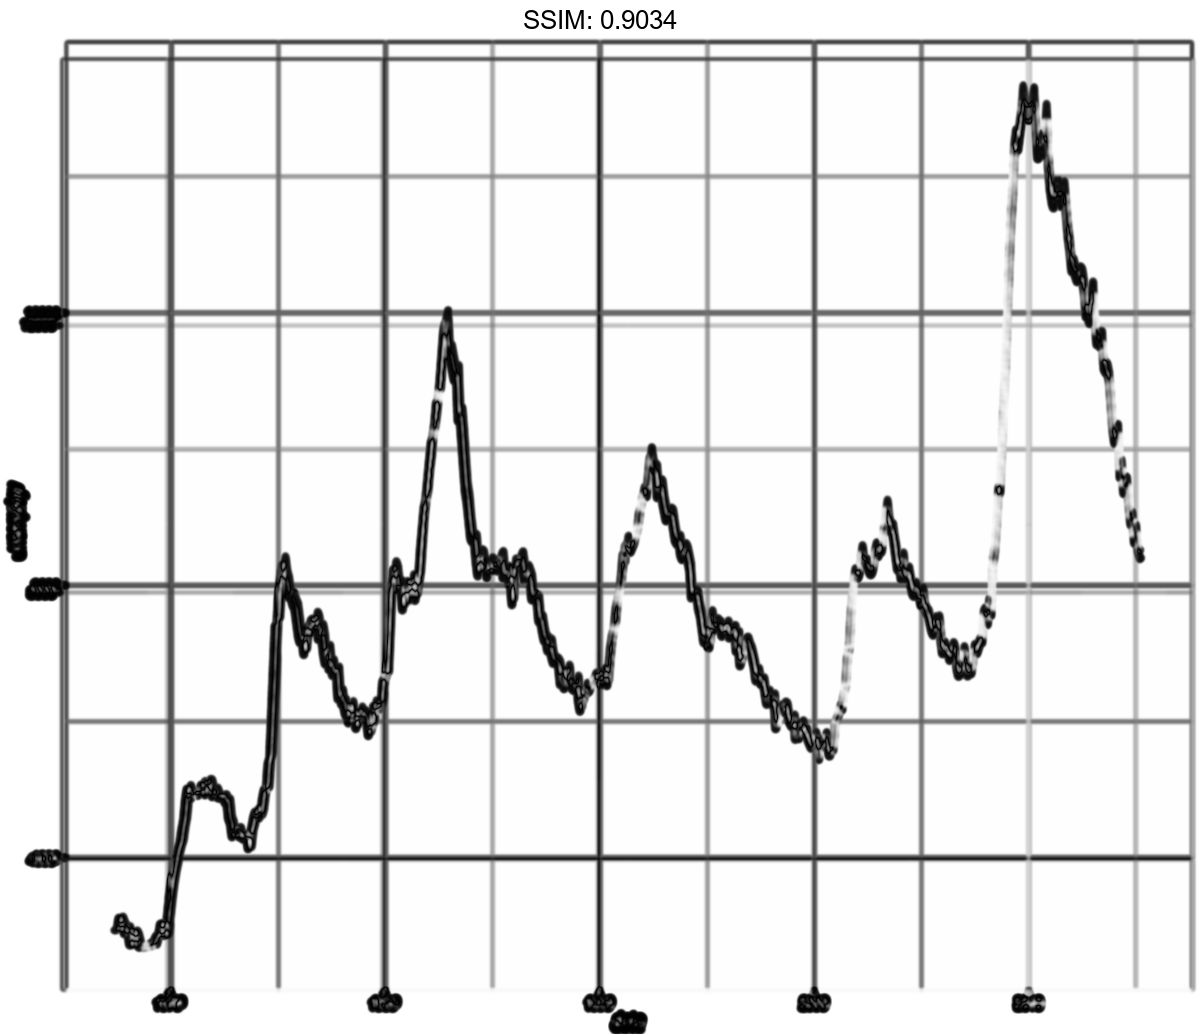
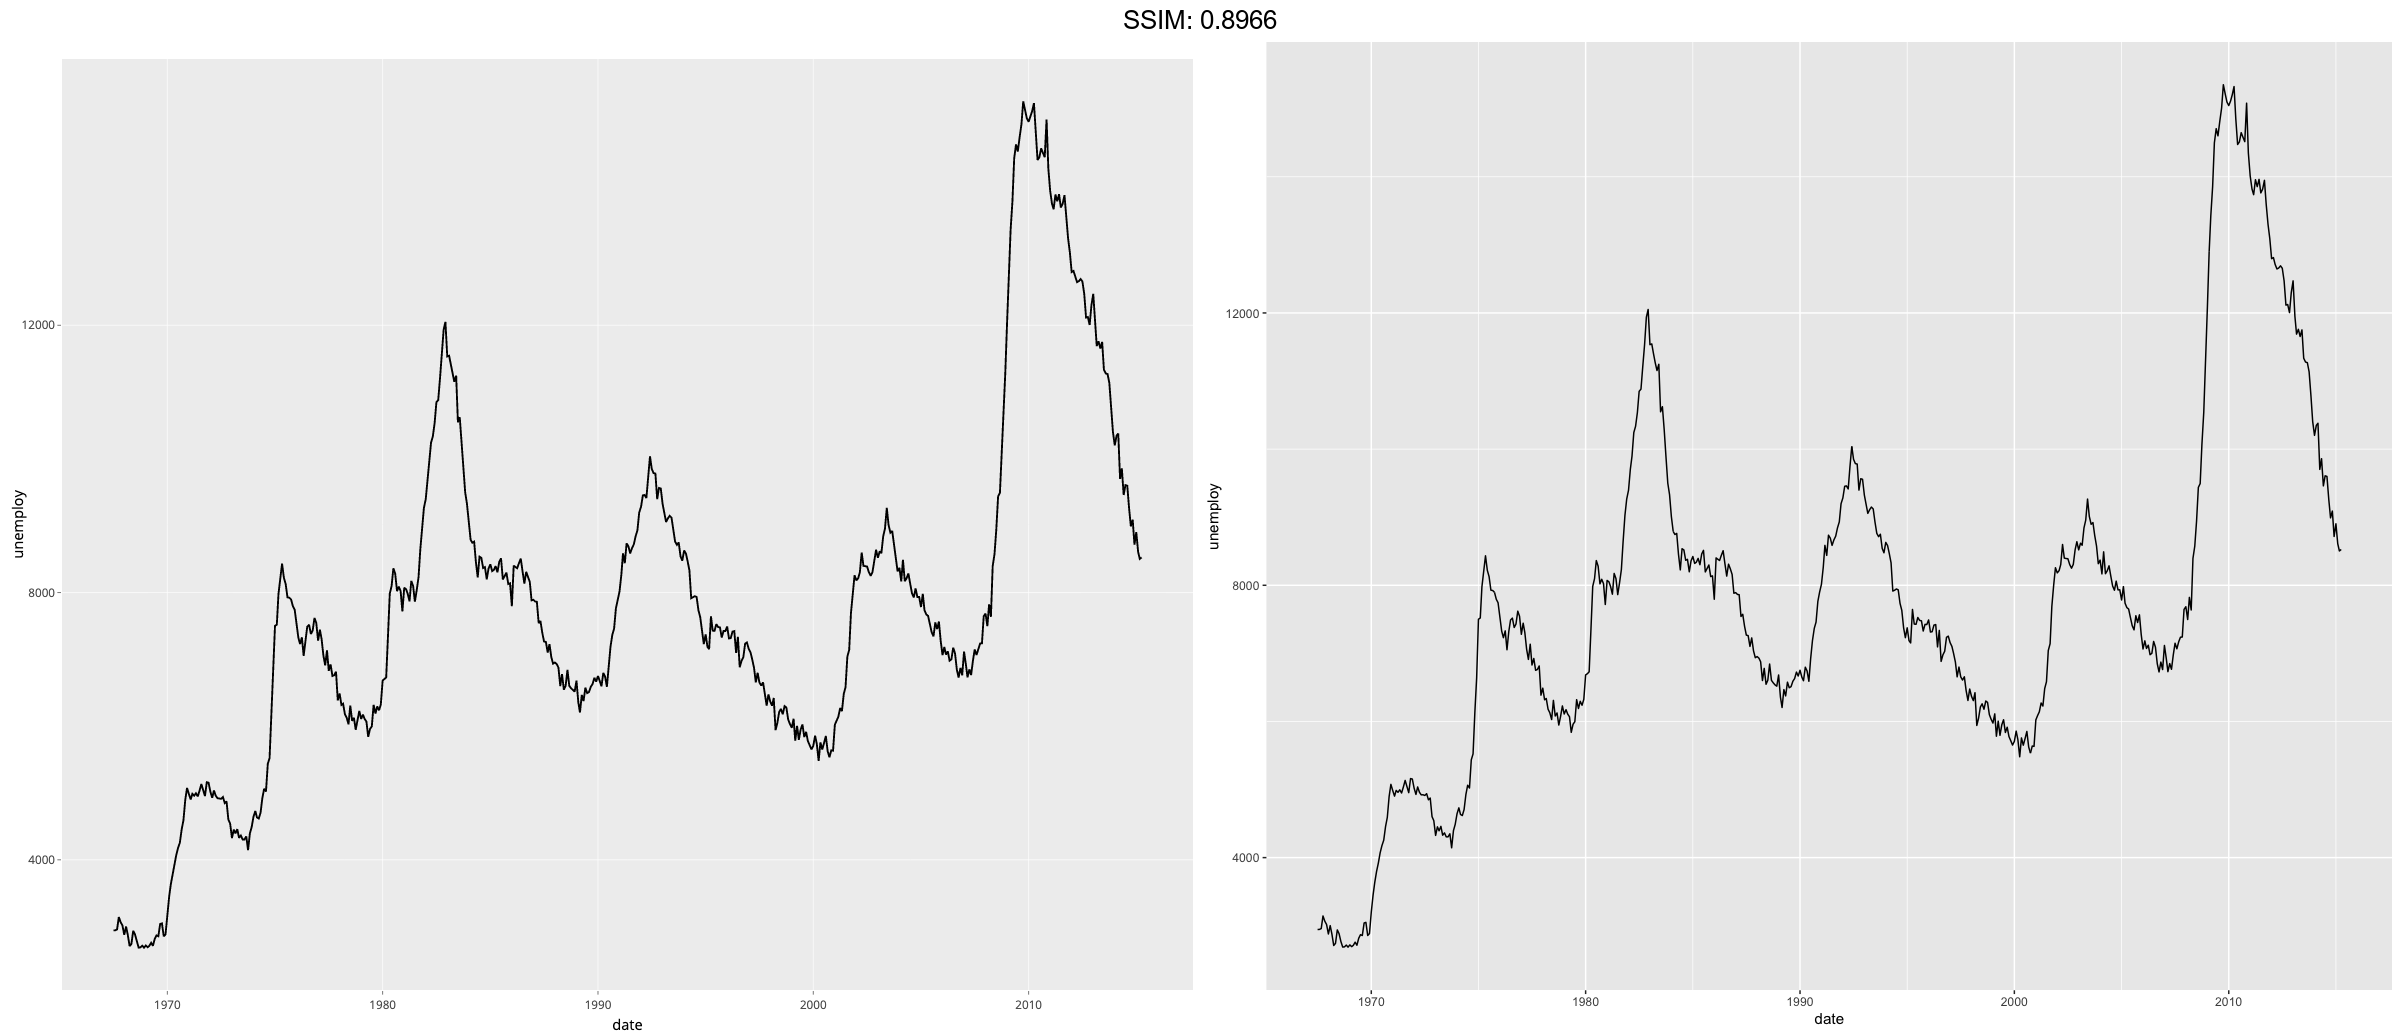
p <- ggplot(economics, aes(x = date, y = unemploy))
p <-  p + geom_line()
plotly::ggplotly(p)

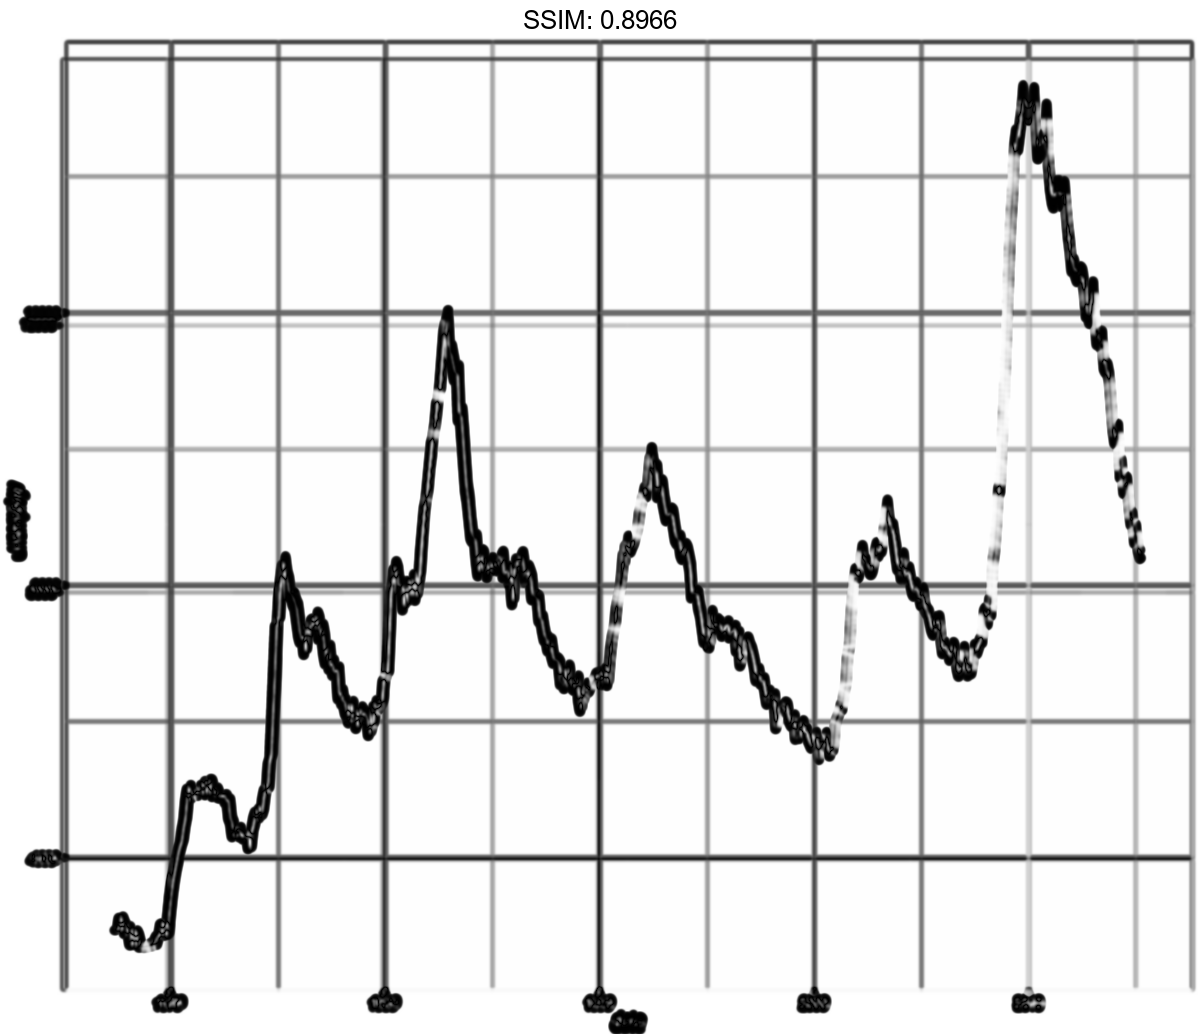
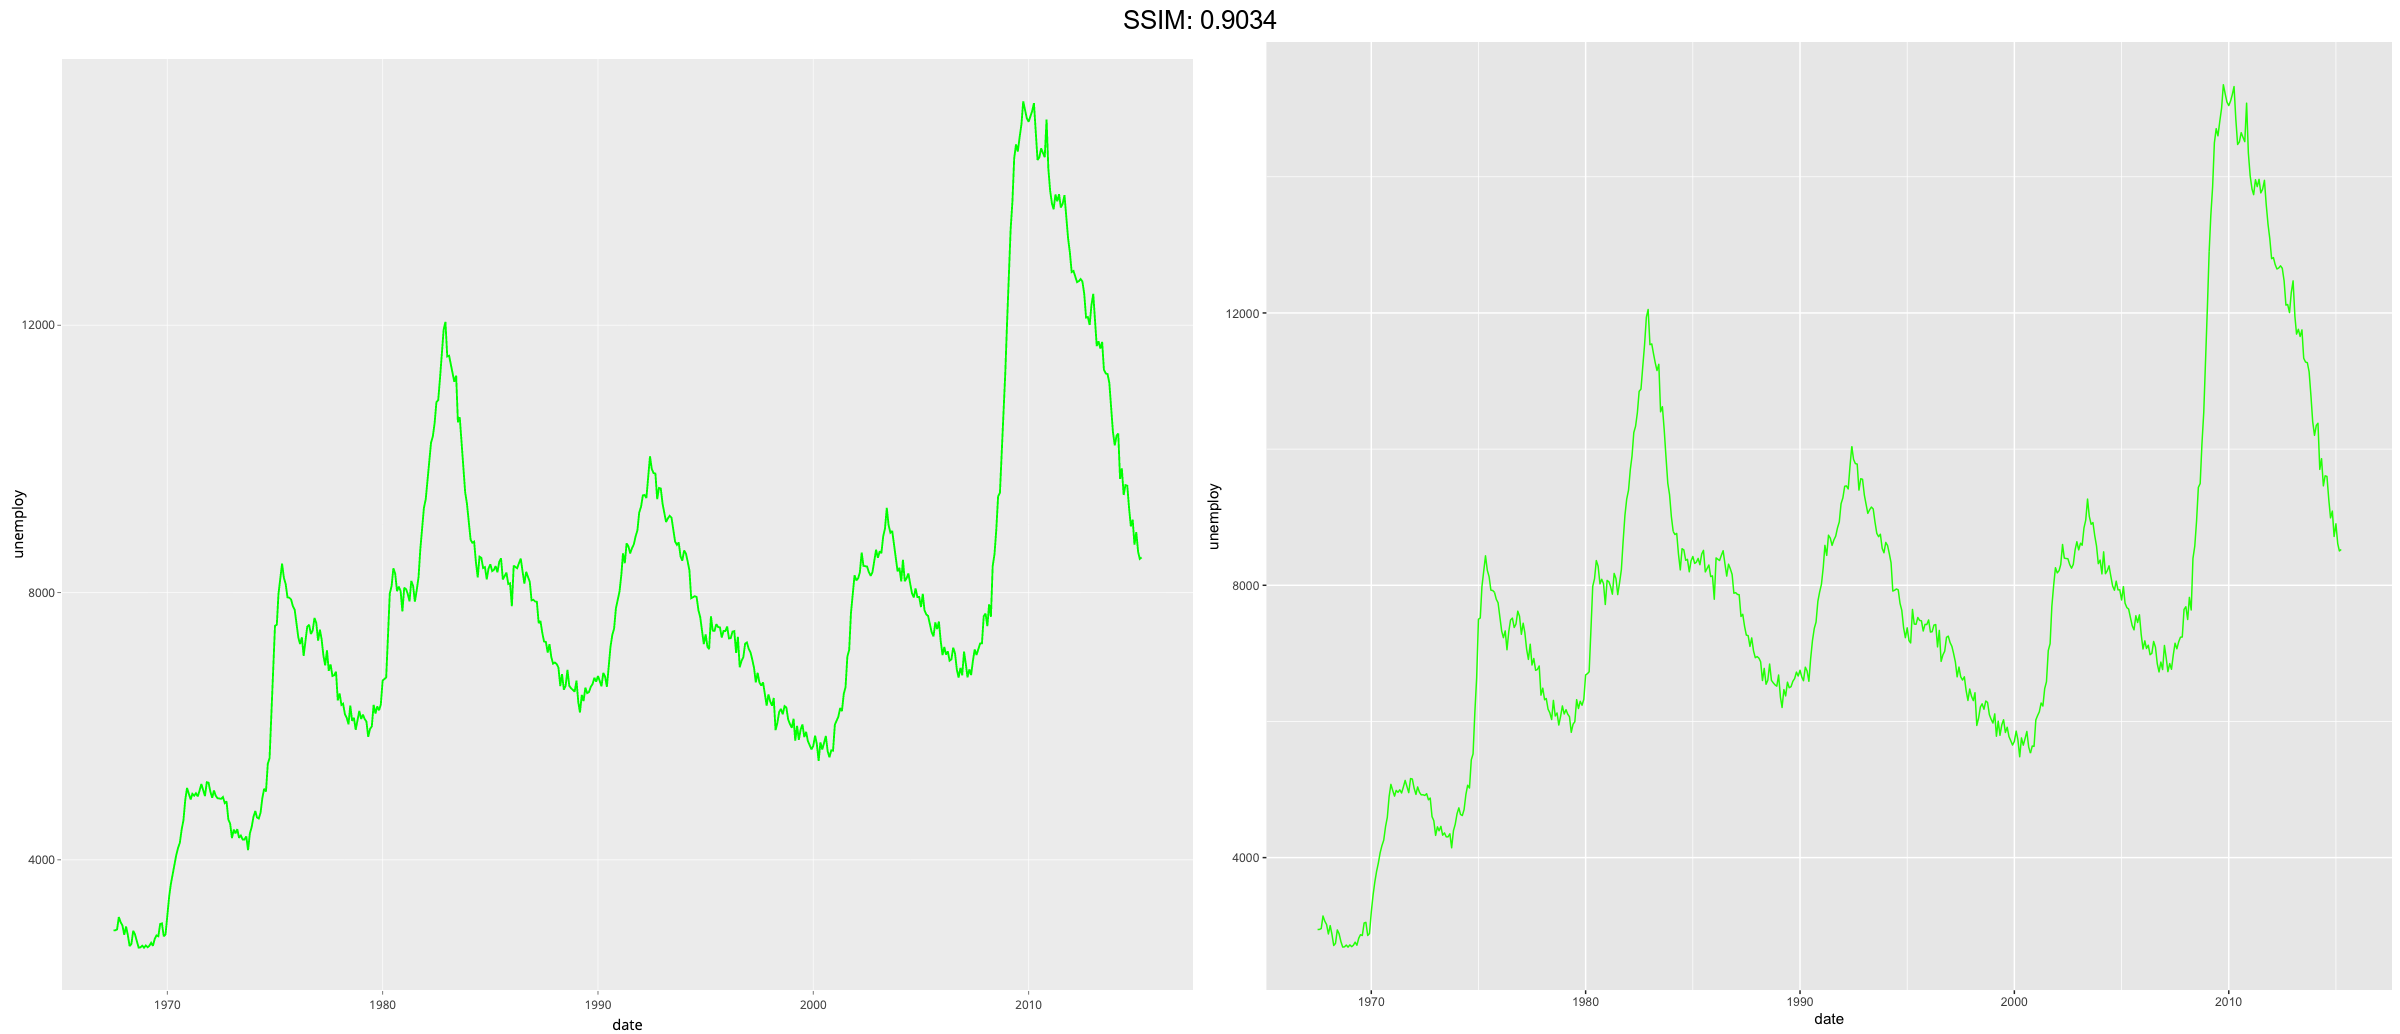
p <- ggplot(economics, aes(x = date, y = unemploy))
p <-  p + geom_line(colour = "green")
plotly::ggplotly(p)
p <- ggplot(economics, aes(x = date, y = unemploy))
p <-  p + geom_point()
plotly::ggplotly(p)
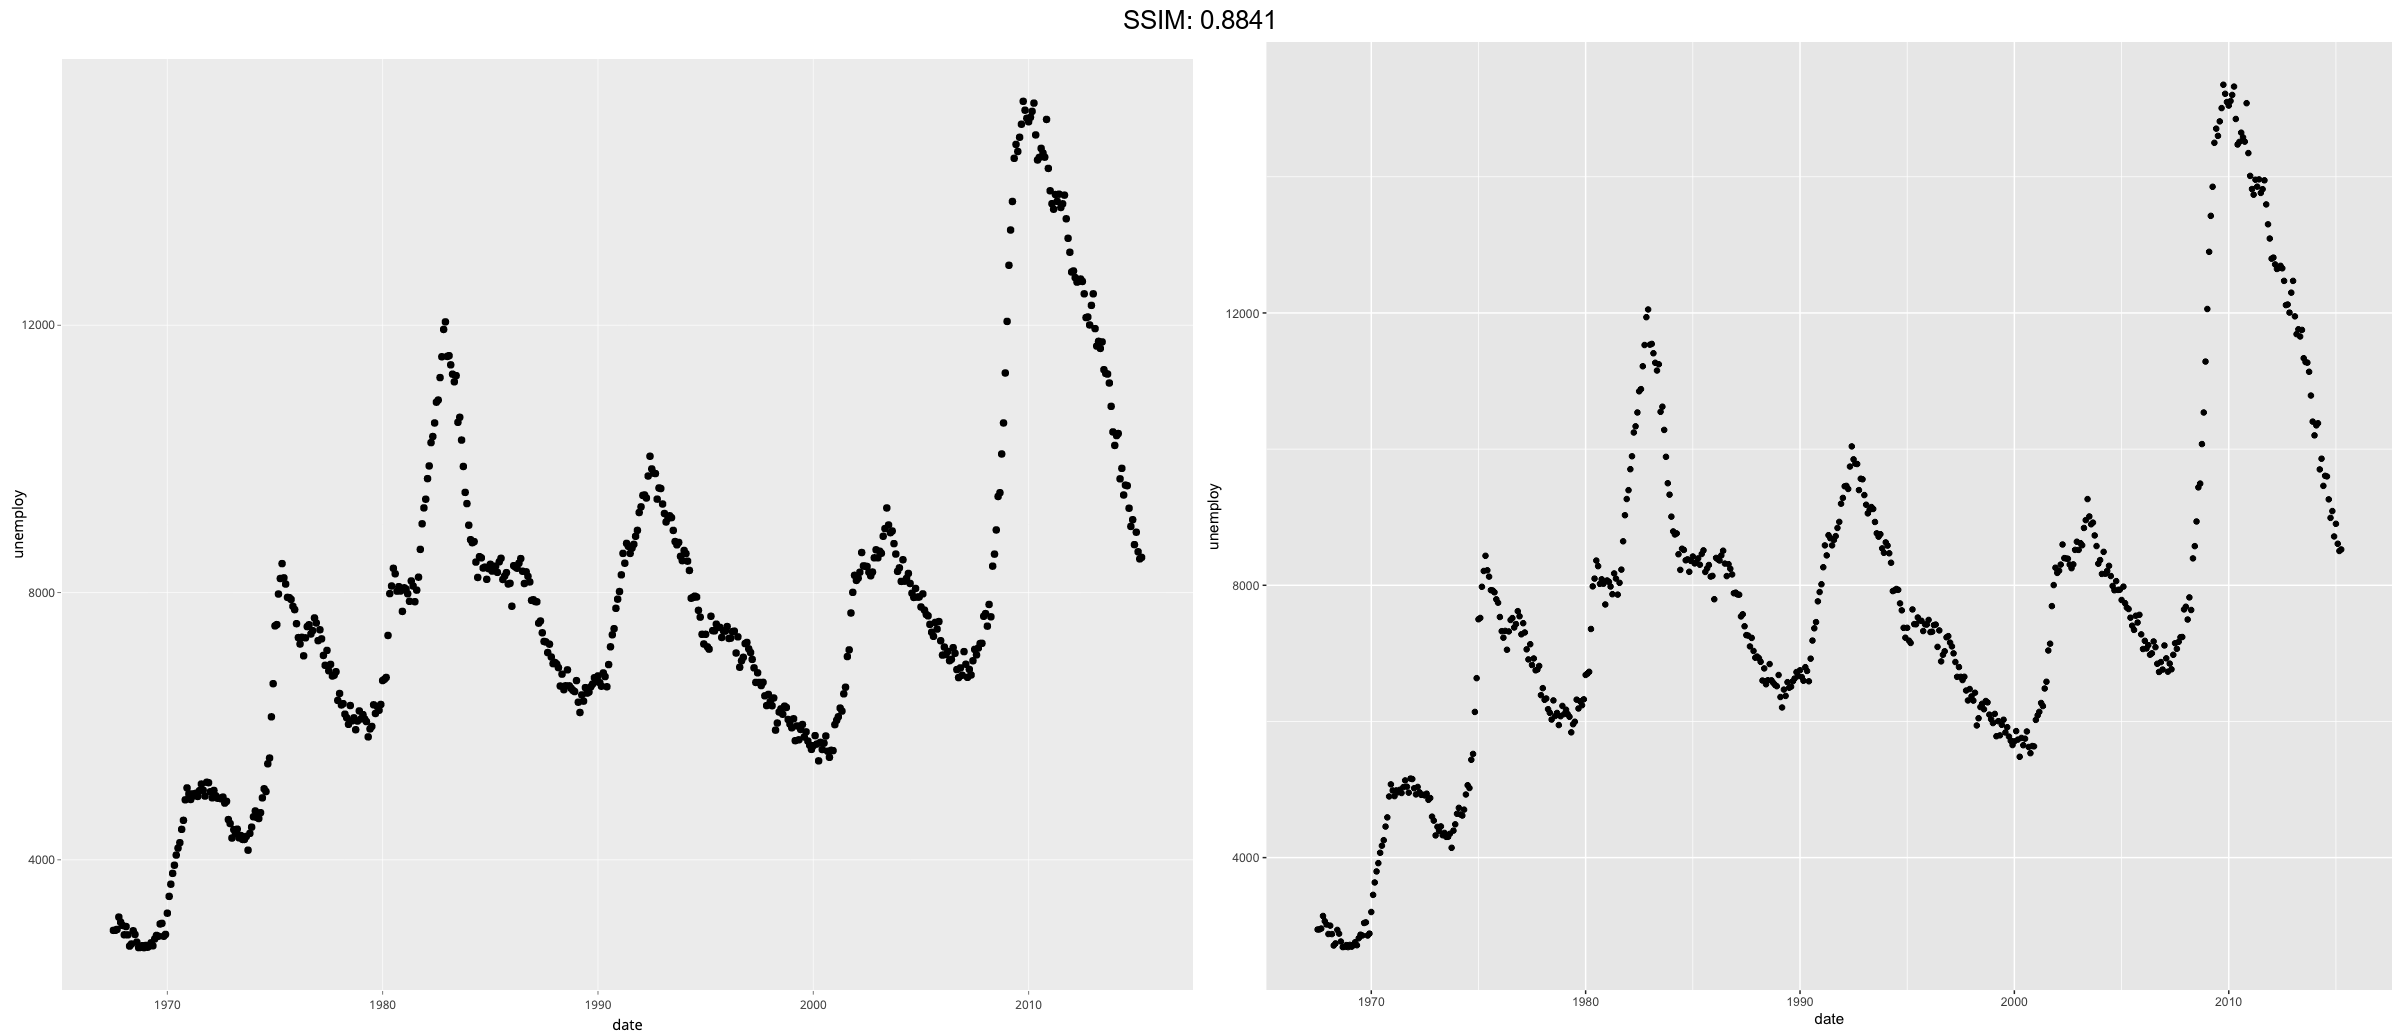
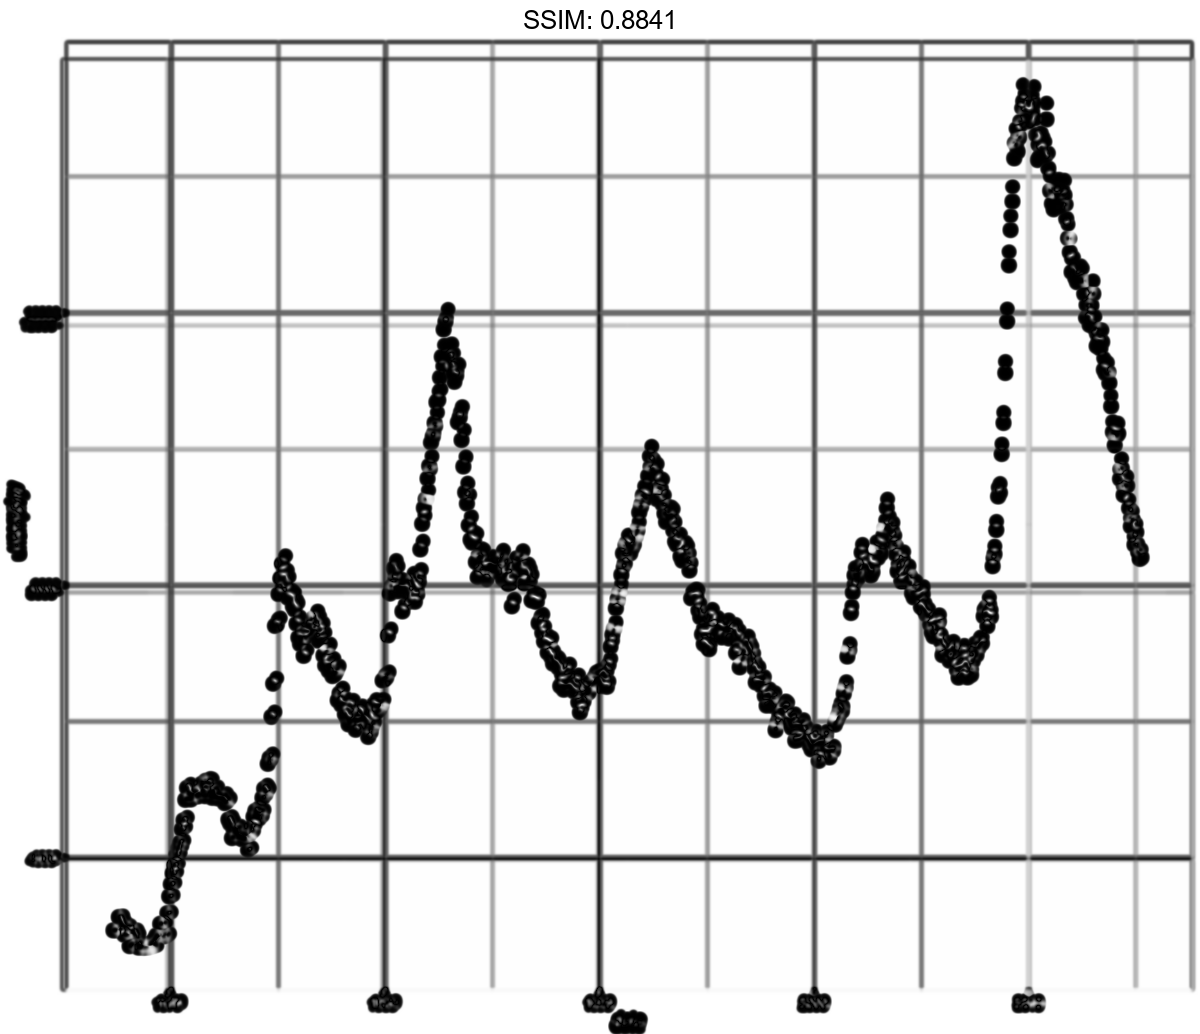
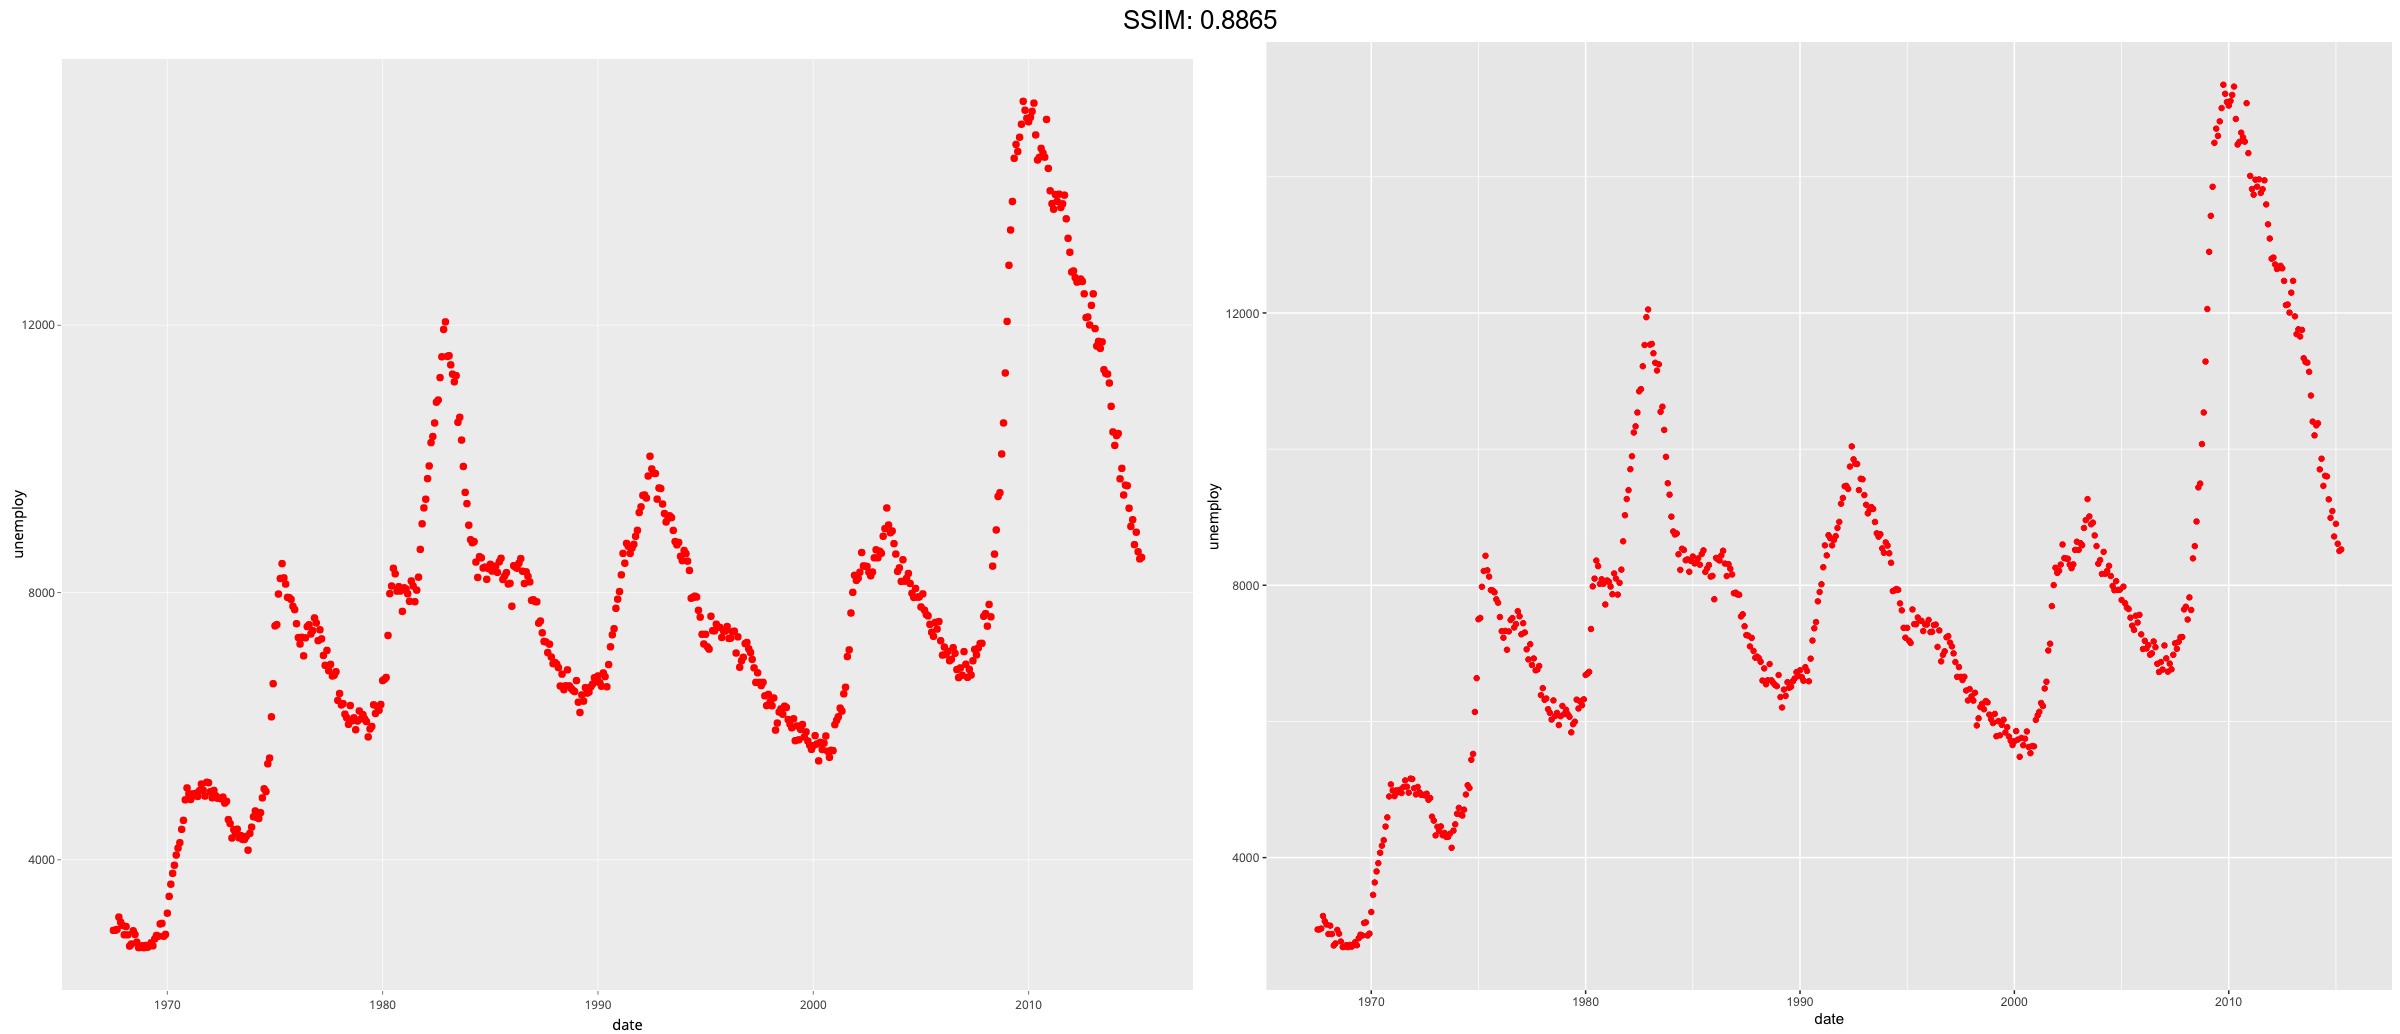
p <- ggplot(economics, aes(x = date, y = unemploy))
p <-  p + geom_point(colour = "red")
plotly::ggplotly(p)

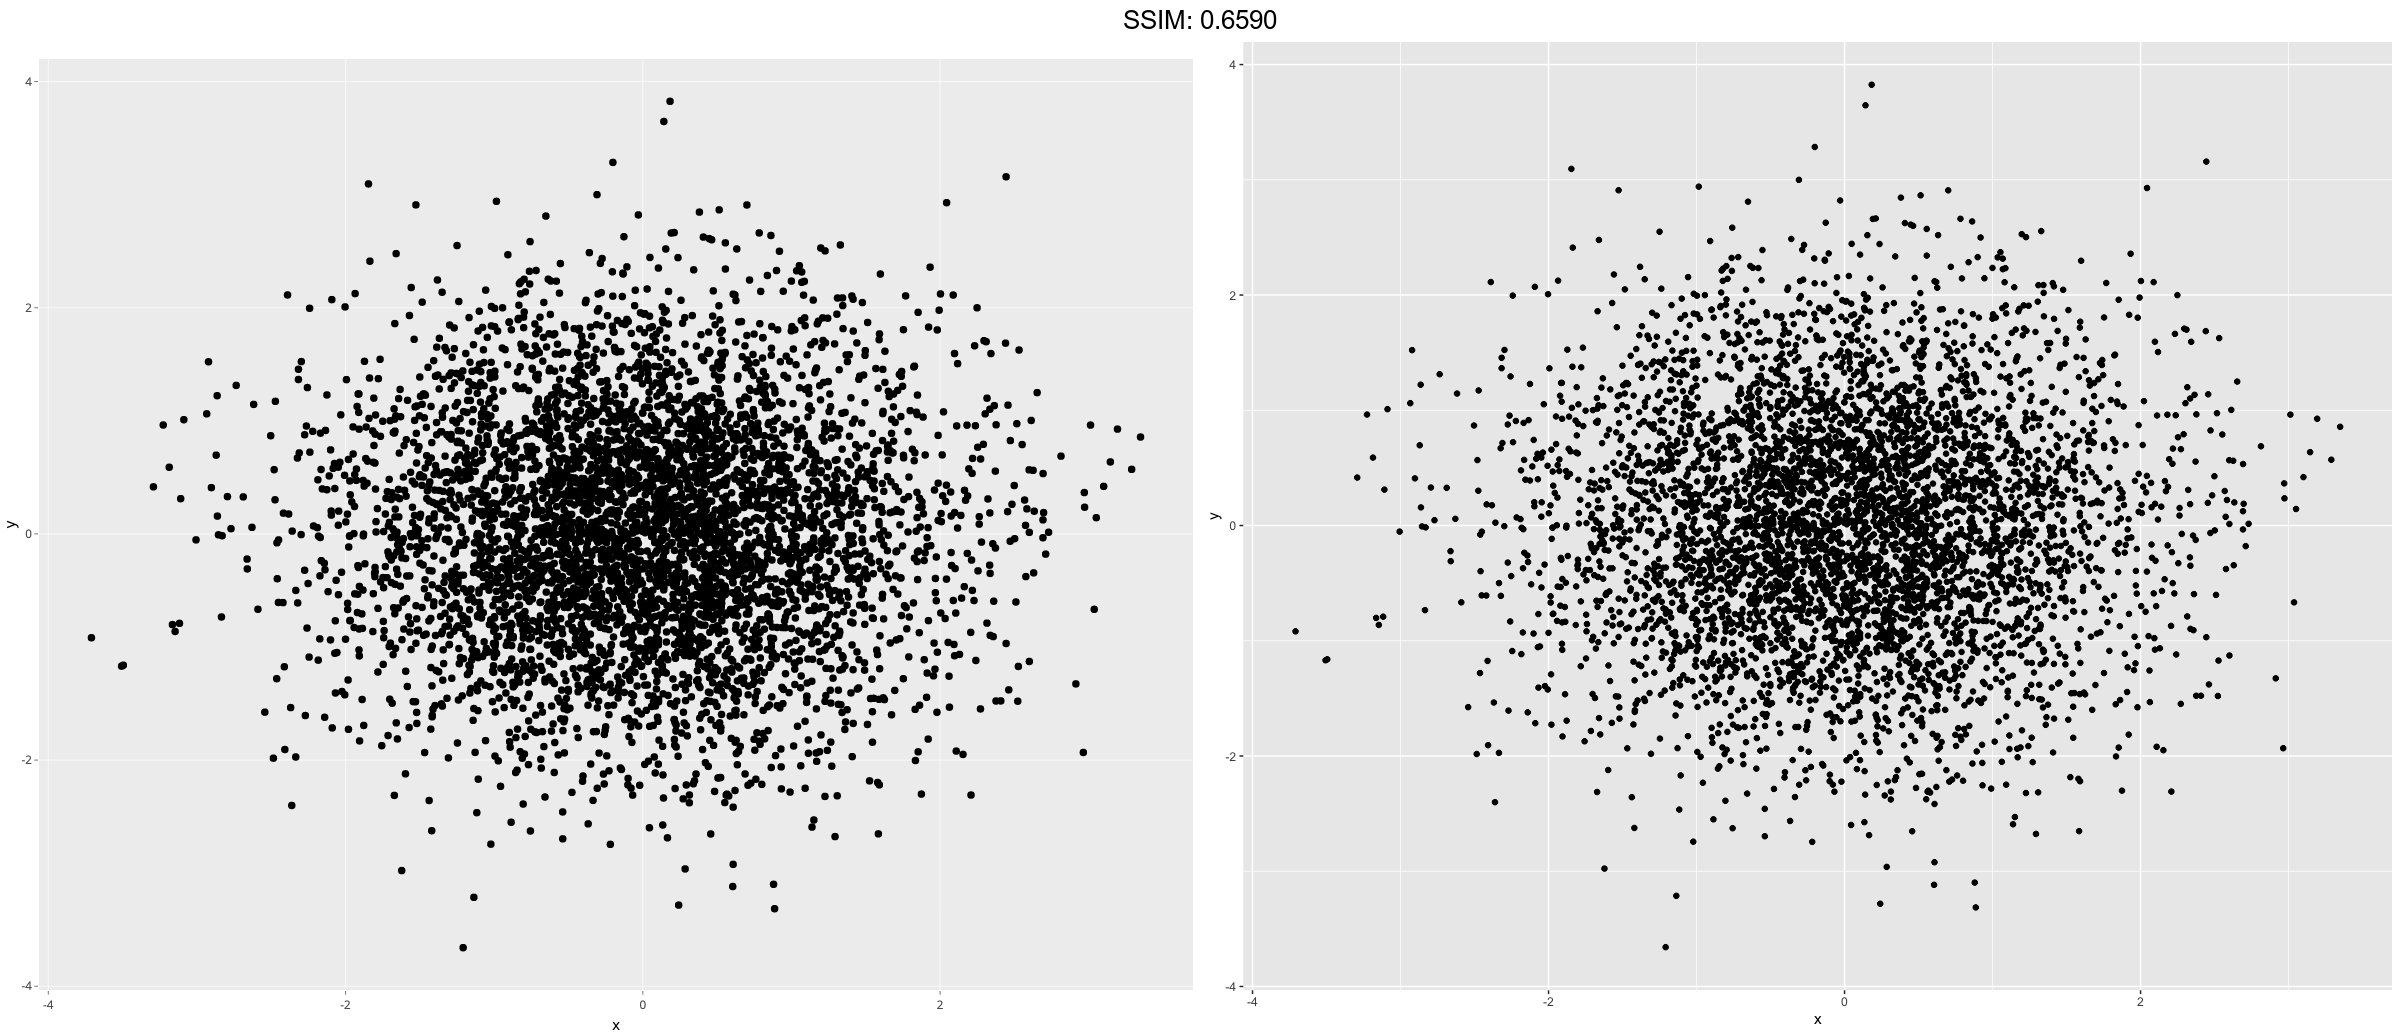
df <- data.frame(x = rnorm(5000), y = rnorm(5000))
p  <- ggplot(df, aes(x,y))
p <-  p + geom_point()
plotly::ggplotly(p)
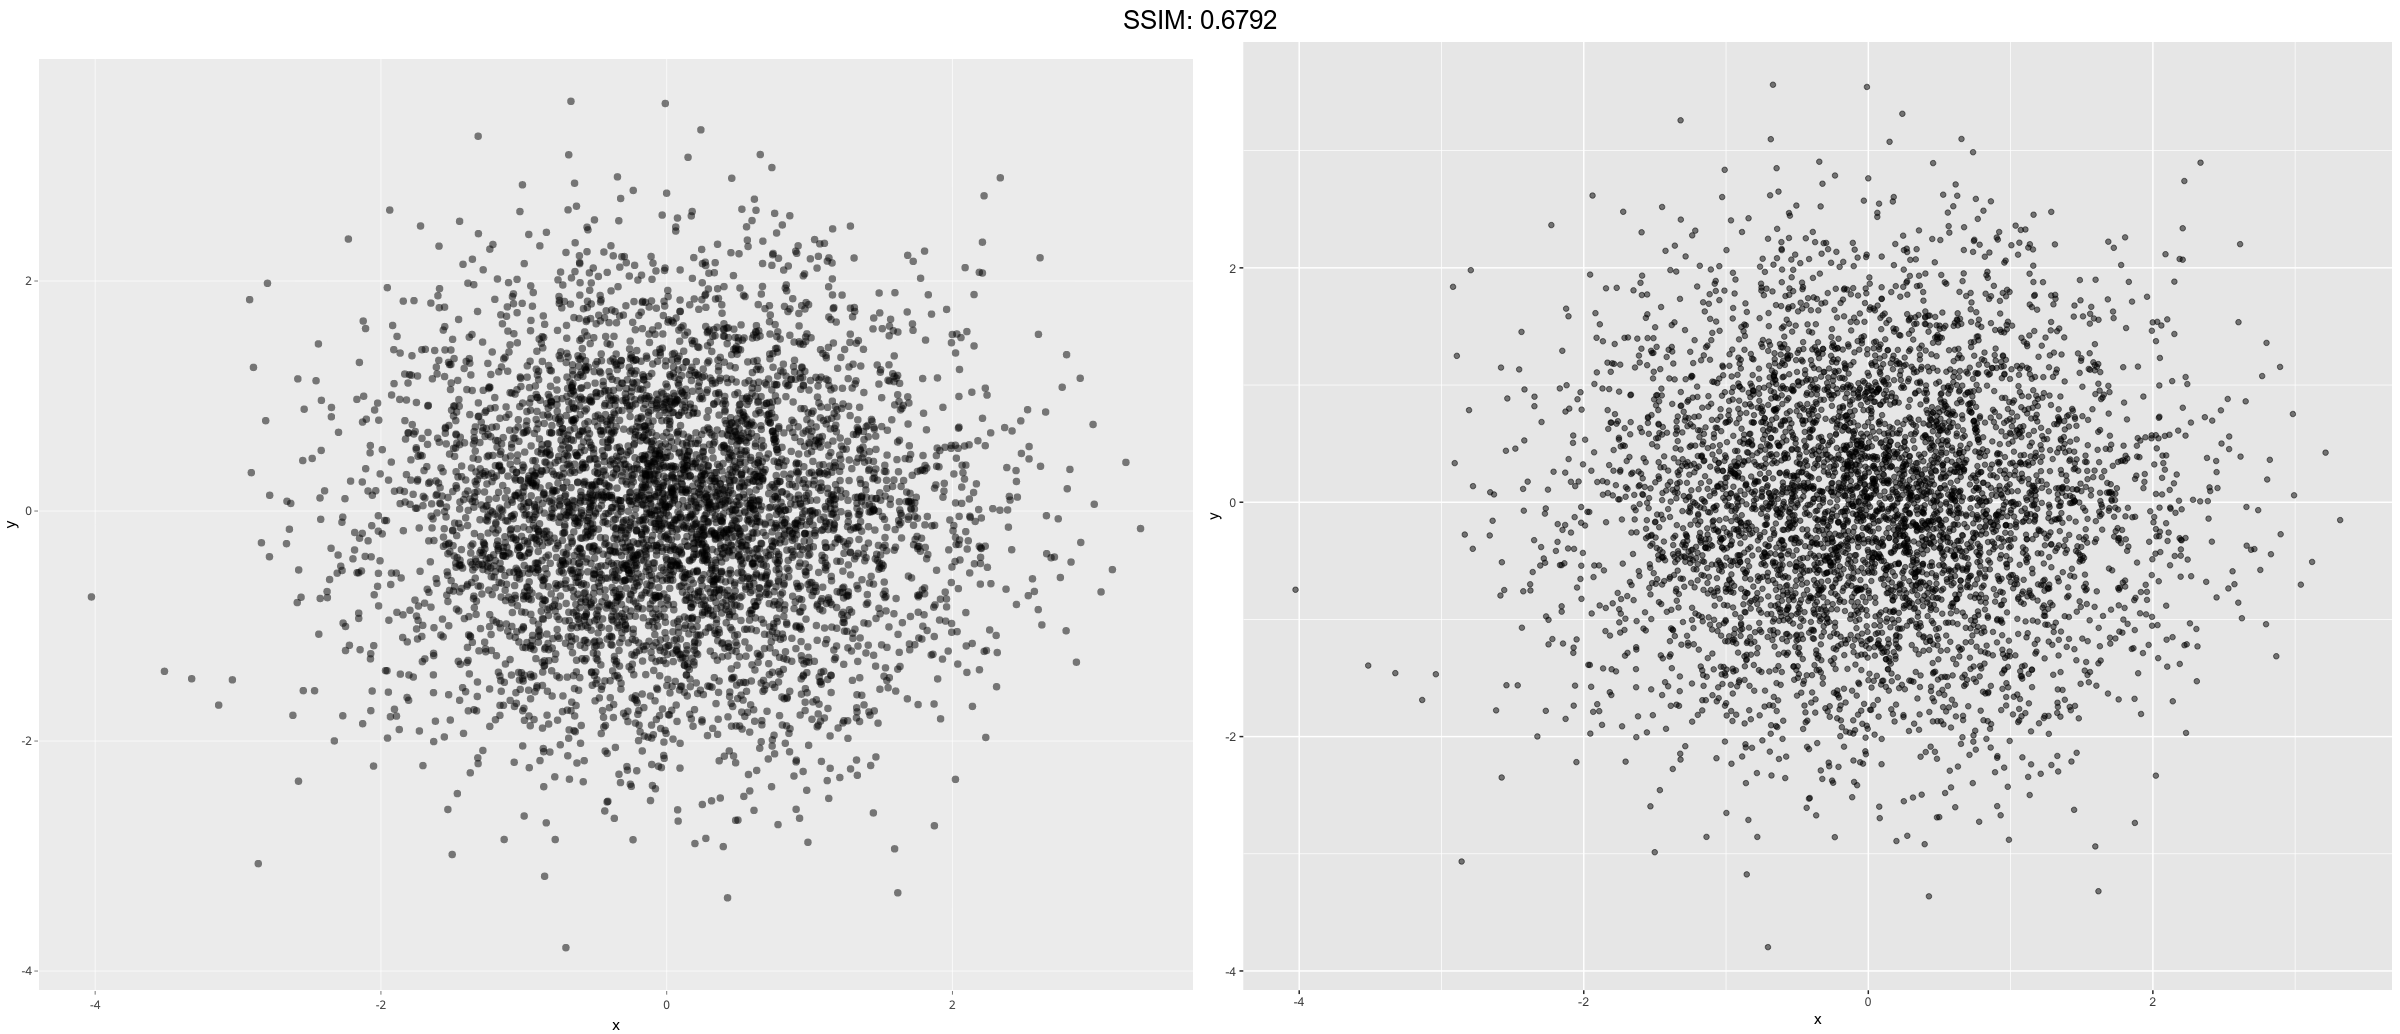
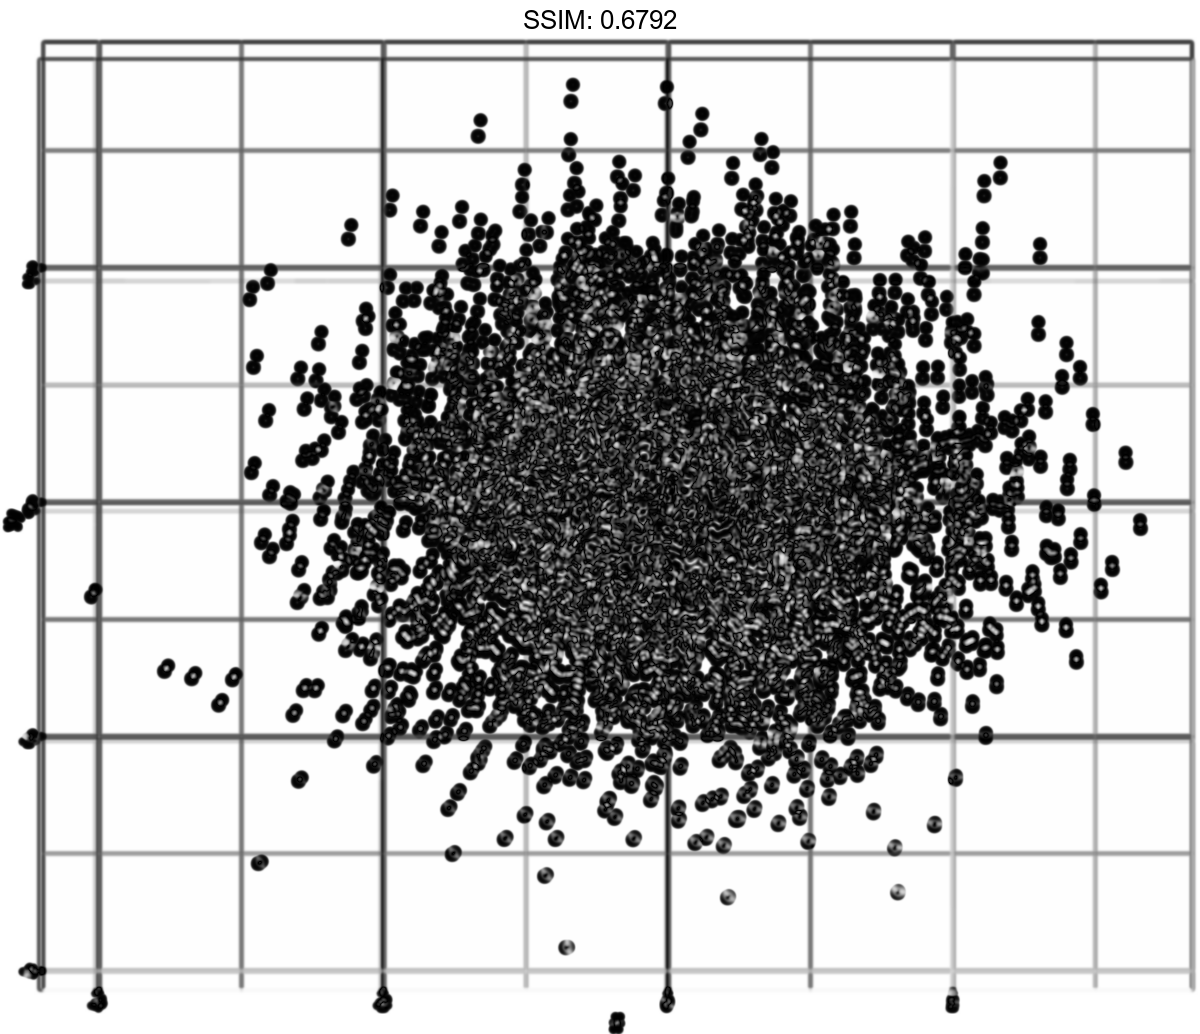
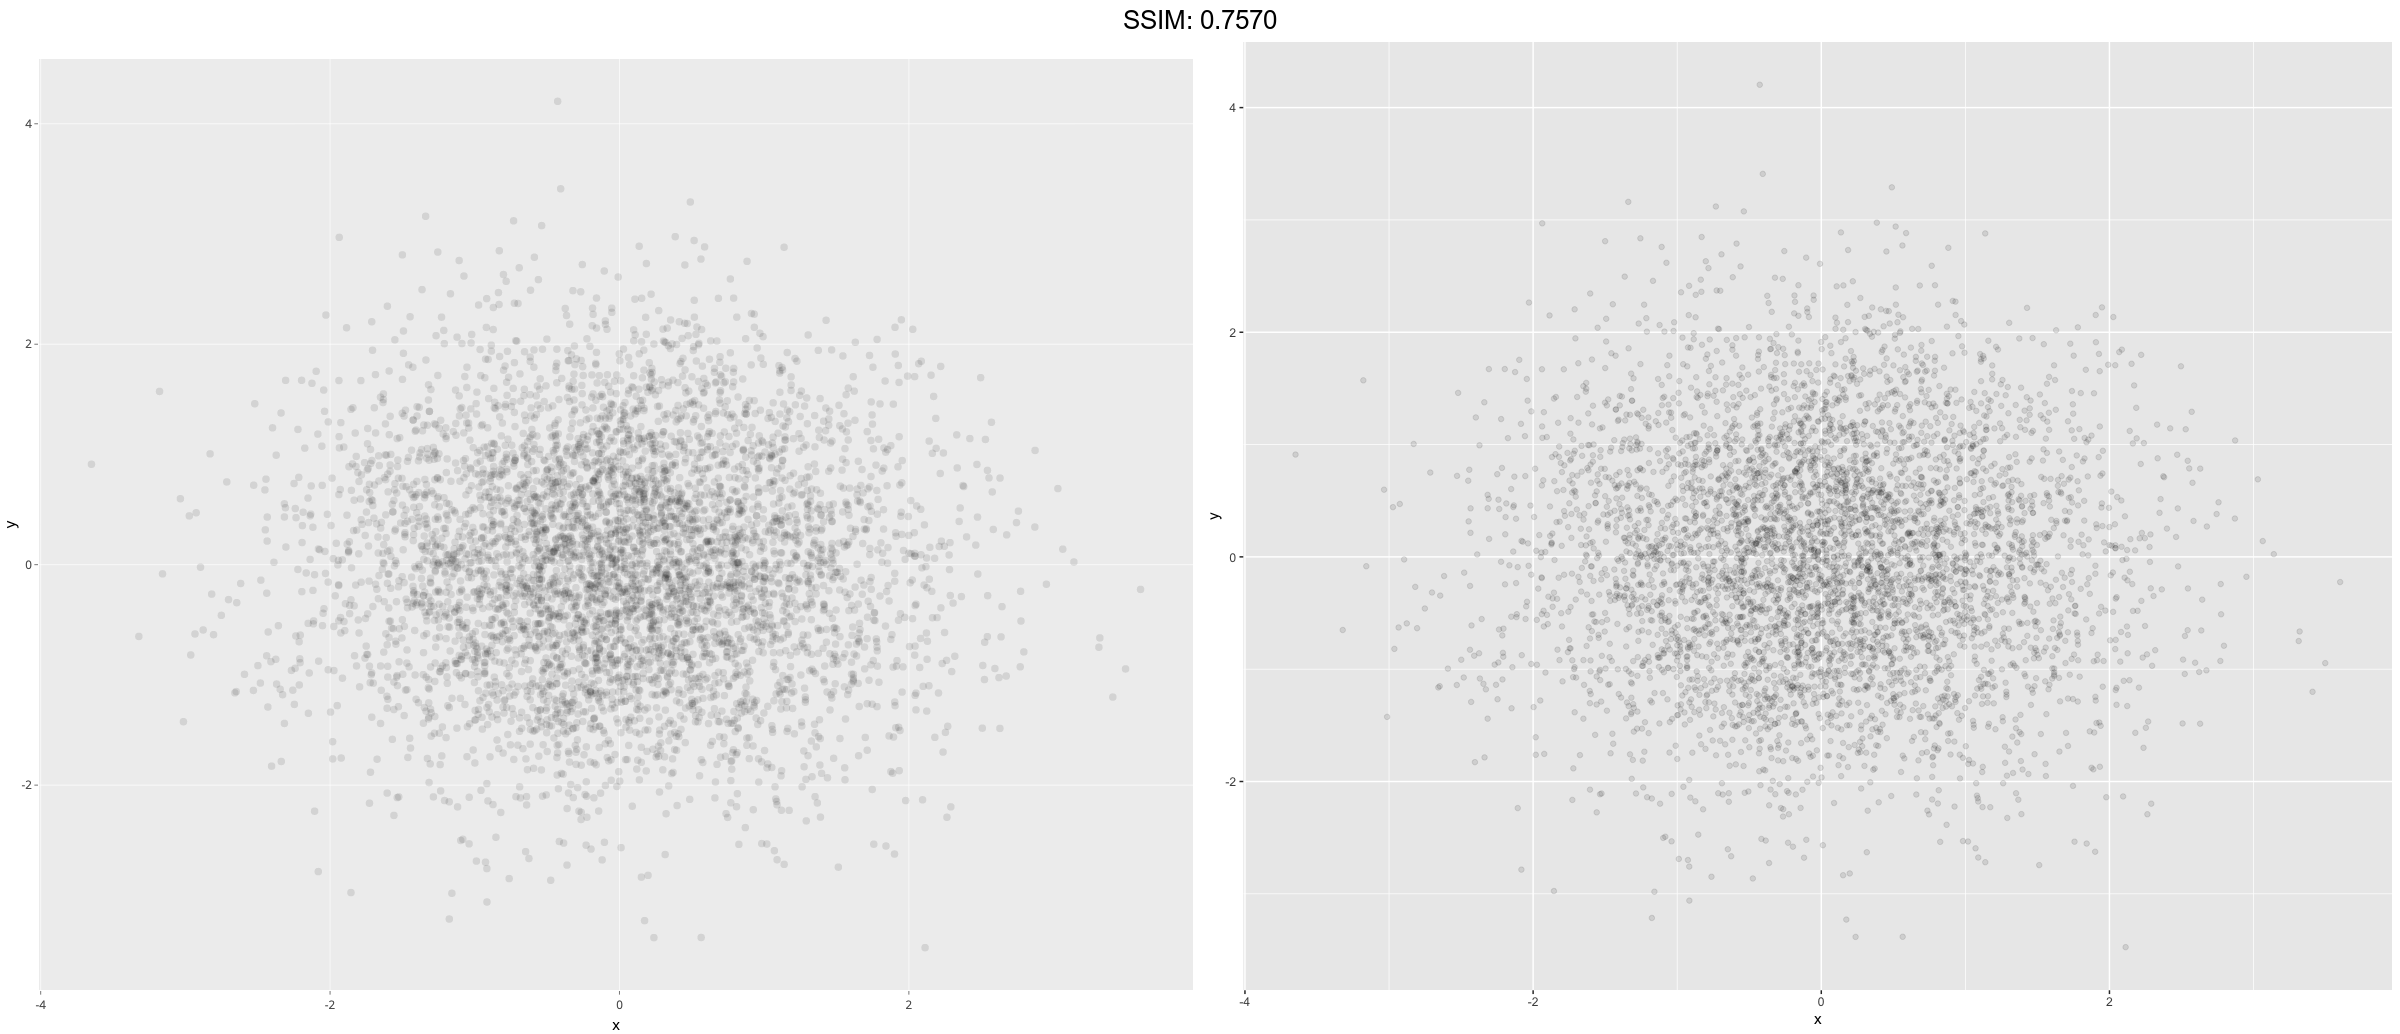
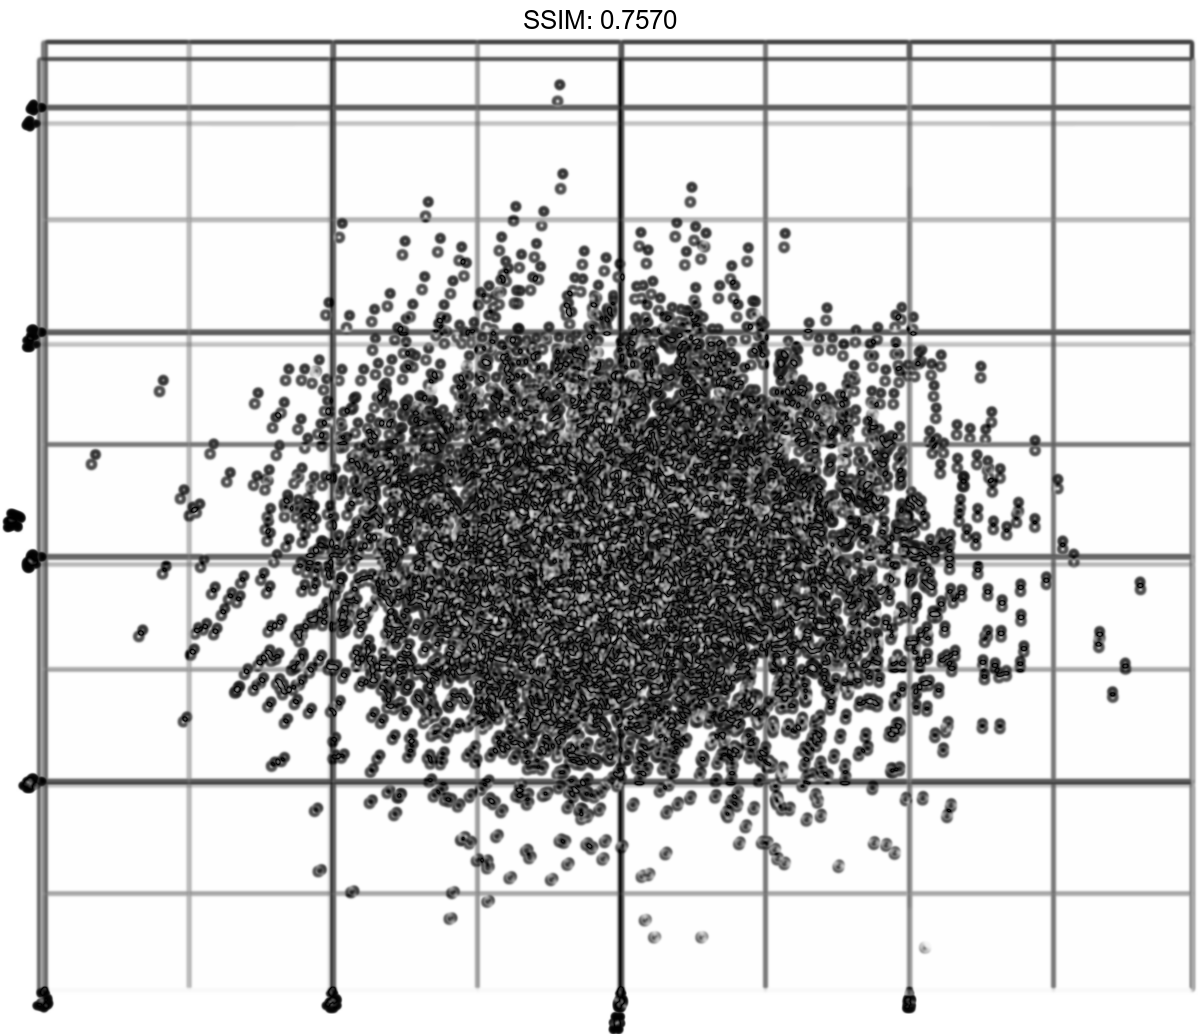
df <- data.frame(x = rnorm(5000), y = rnorm(5000))
p  <- ggplot(df, aes(x,y))
p <-  p + geom_point(alpha = 0.5)
plotly::ggplotly(p)
df <- data.frame(x = rnorm(5000), y = rnorm(5000))
p  <- ggplot(df, aes(x,y))
p <-  p + geom_point(alpha = 1/10)
plotly::ggplotly(p)
p <- ggplot(economics, aes(x = date, y = unemploy)) + geom_line()
plotly::ggplotly(p)

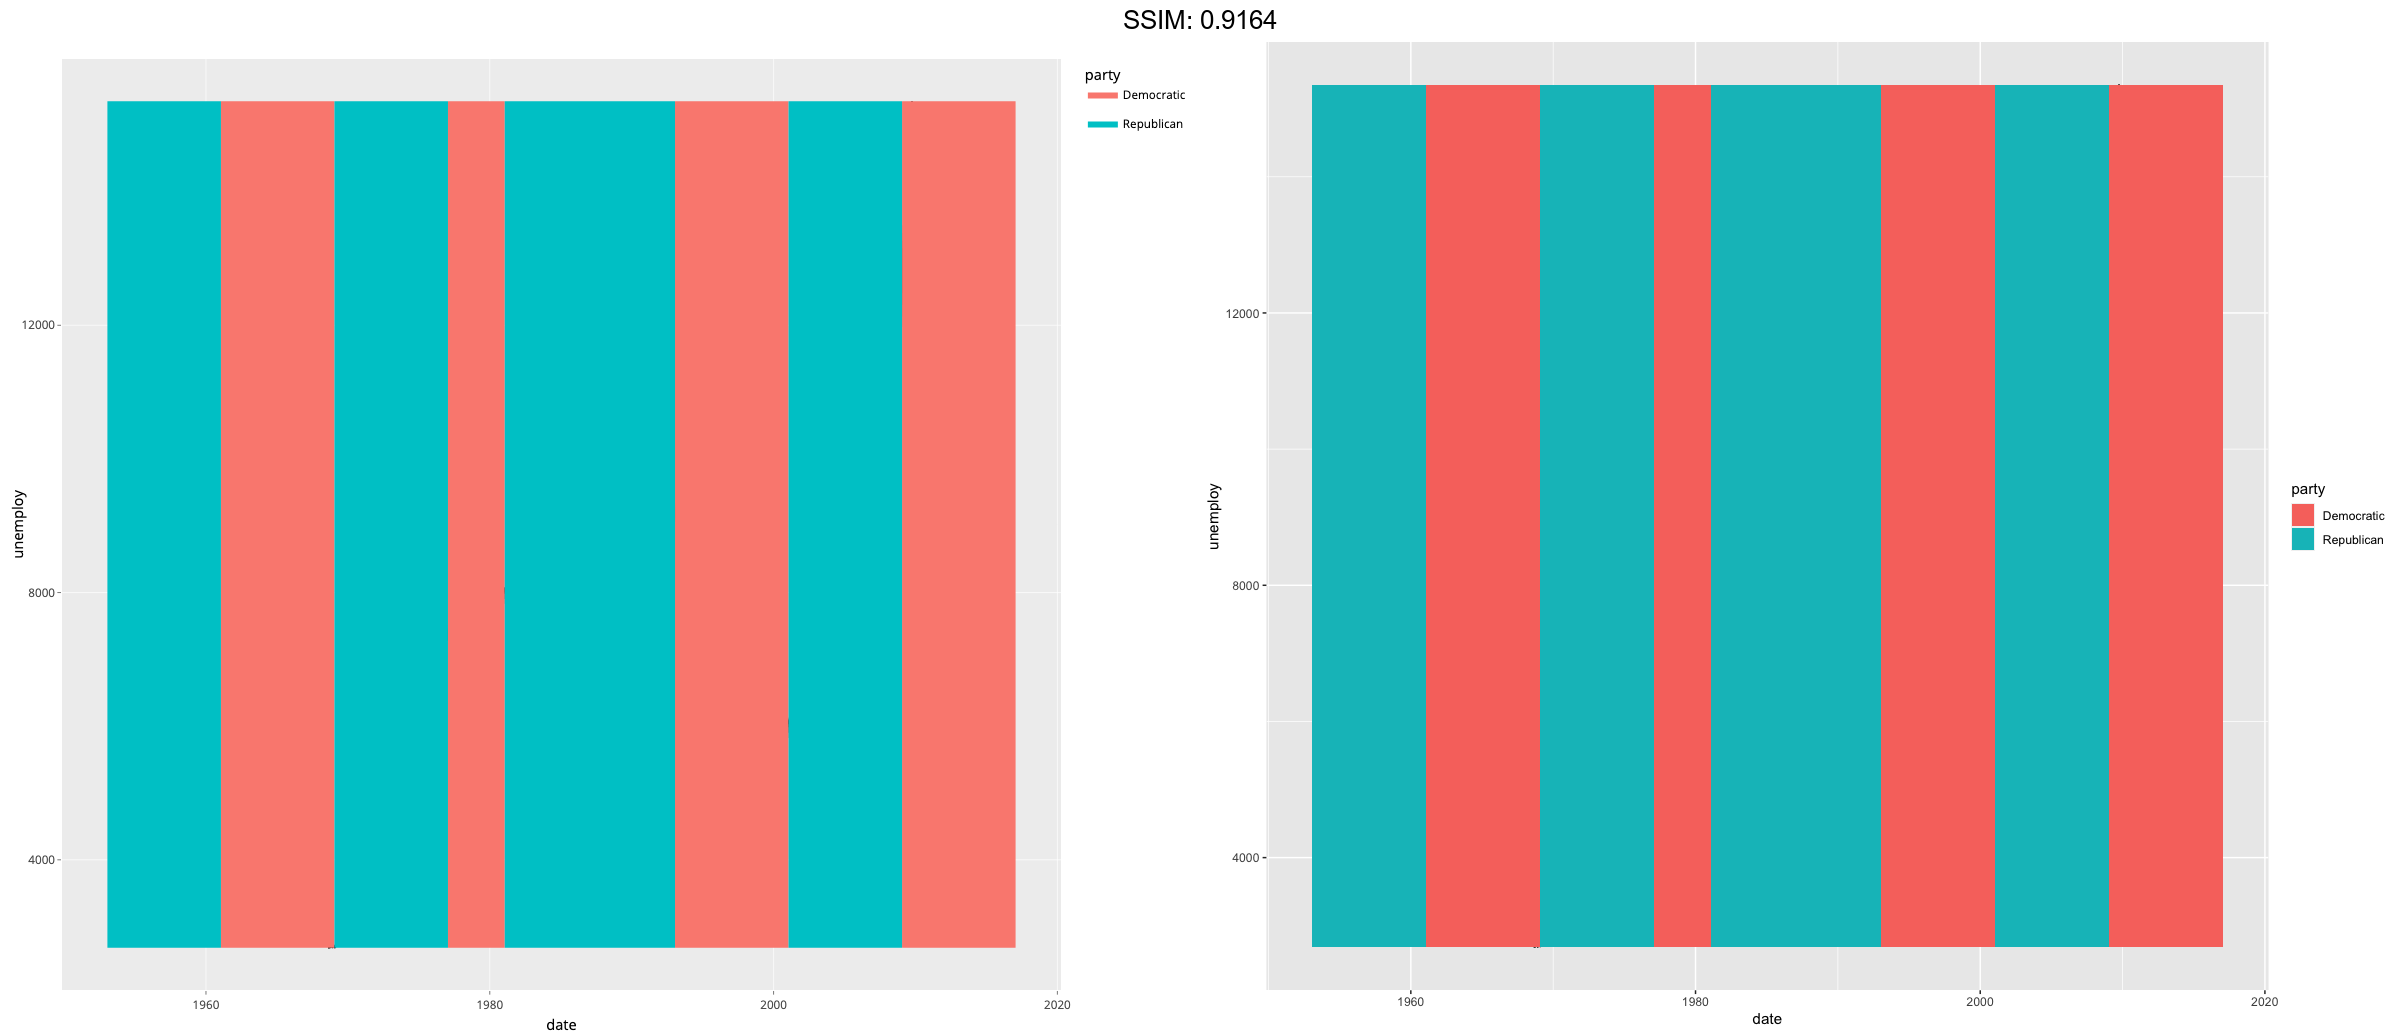
p <- ggplot(economics, aes(x = date, y = unemploy)) + geom_line()
yrng <- range(economics$unemploy)
p <- p +
  geom_rect(
    aes(NULL, NULL, xmin = start, xmax = end, fill = party),
    ymin = yrng[1], ymax = yrng[2], data = presidential
  )
plotly::ggplotly(p)
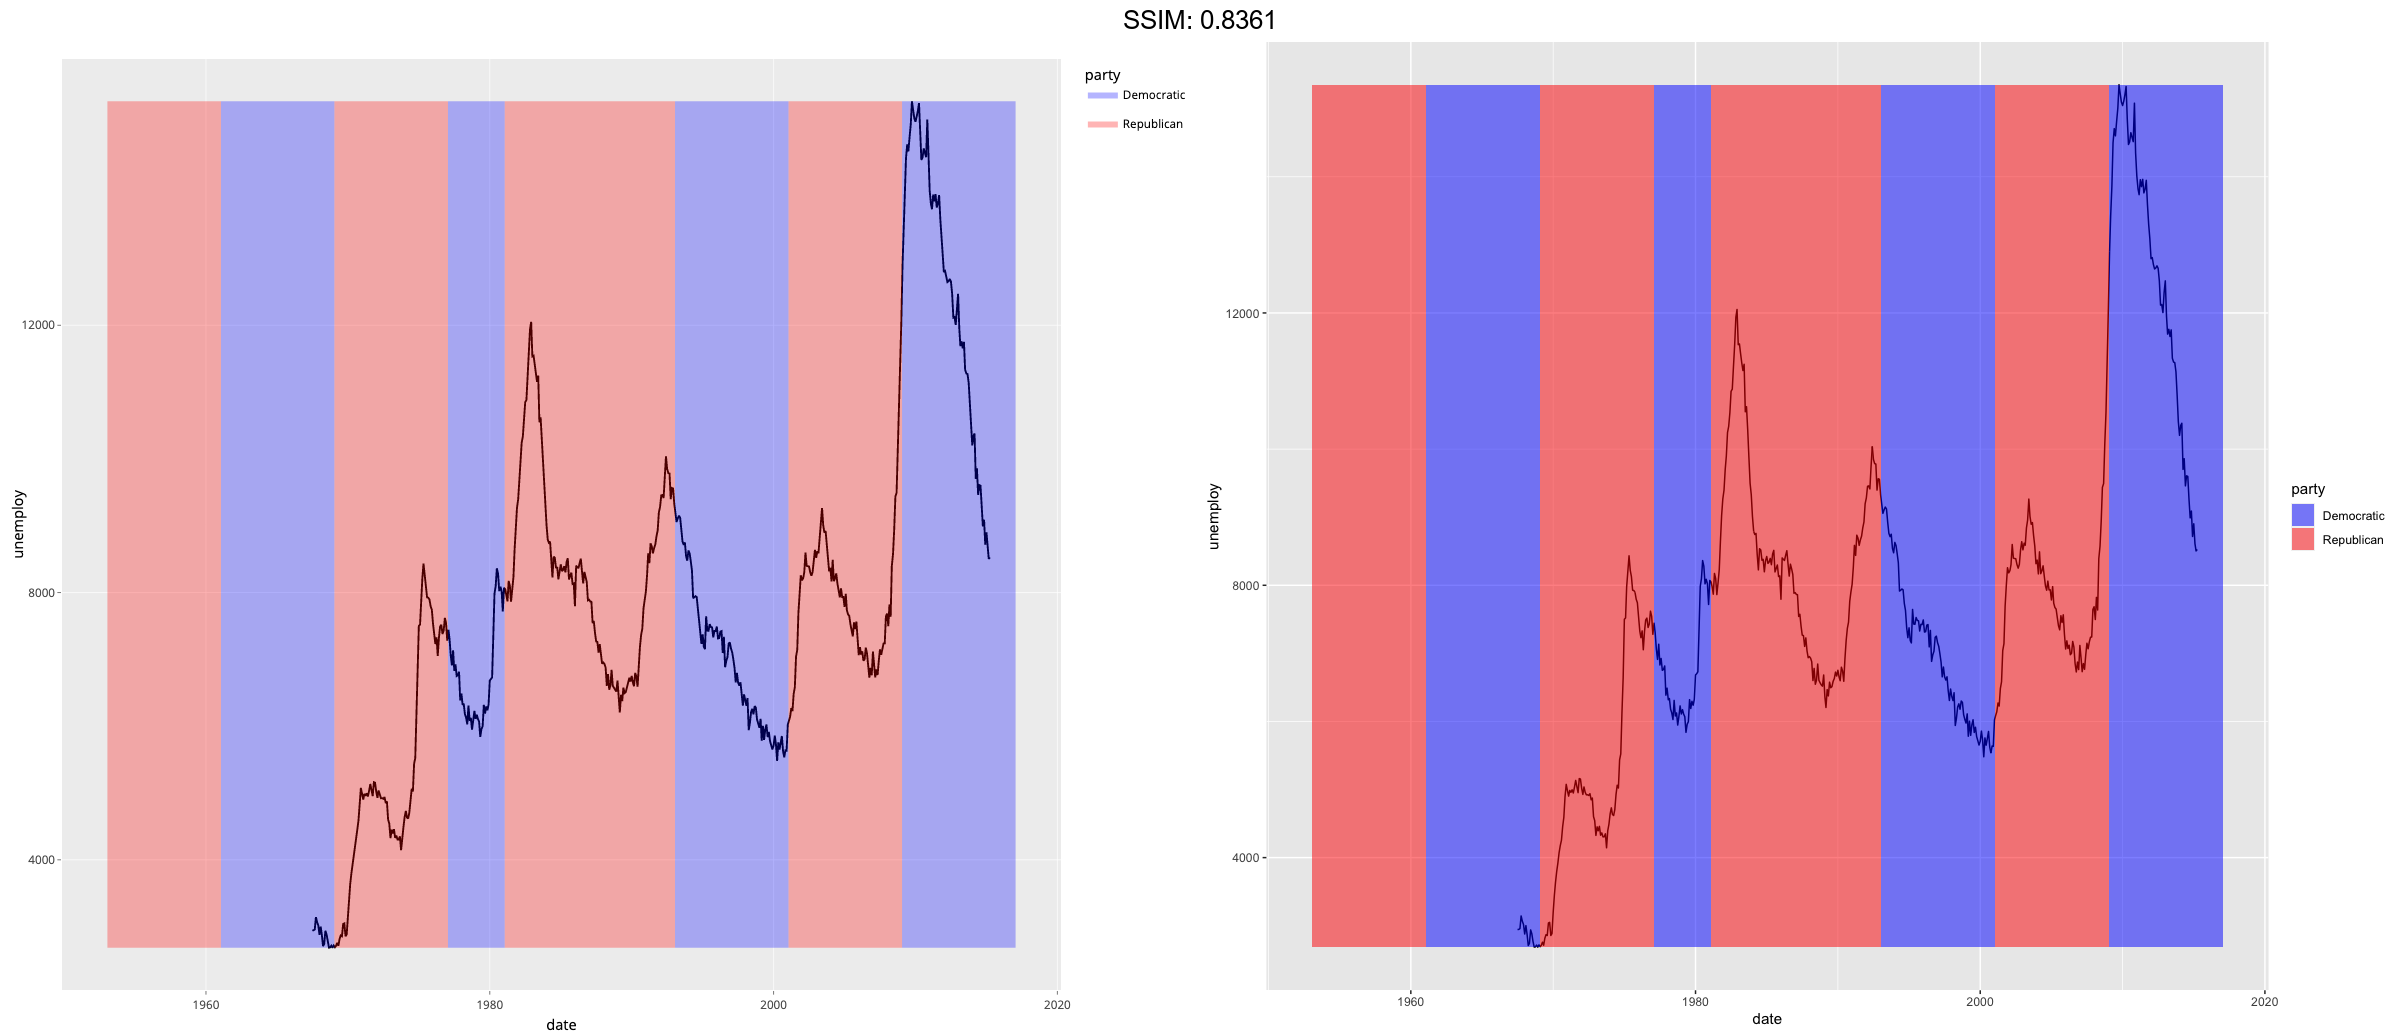
p <- p +
  geom_rect(
    aes(NULL, NULL, xmin = start, xmax = end, fill = party),
    ymin = yrng[1], ymax = yrng[2], data = presidential
  )
p <-  p + scale_fill_manual(values = alpha(c("blue", "red"), .3))
plotly::ggplotly(p)