Edit chart
Loading graph
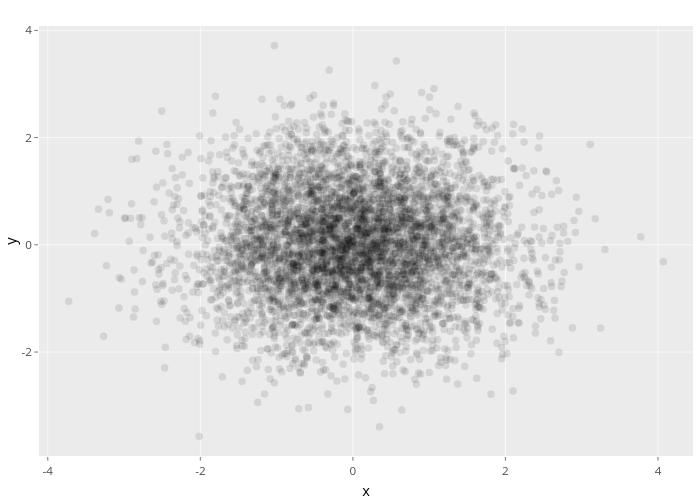
Nadhil's interactive graph and data of "y vs x" is a scatter chart; with x in the x-axis and y in the y-axis.. The x-axis shows values from -4.11523848812045 to 4.4591100546762. The y-axis shows values from -3.93910113476286 to 4.08175932991531.