Edit chart
Loading graph
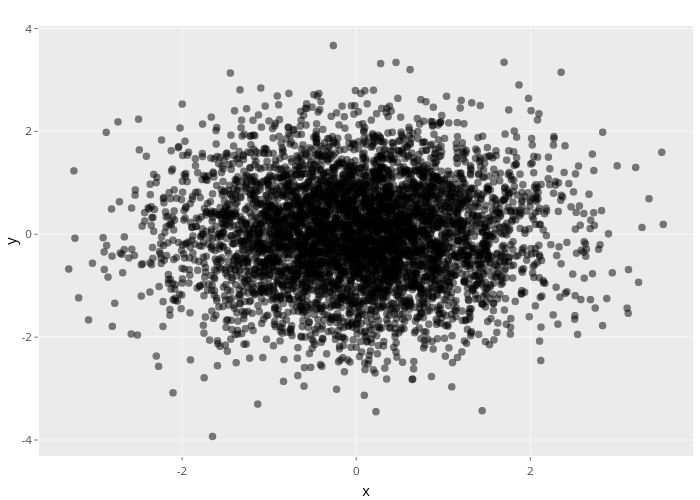
Nadhil's interactive graph and data of "y vs x" is a scatter chart; with x in the x-axis and y in the y-axis.. The x-axis shows values from -3.64267880023699 to 3.86704673568747. The y-axis shows values from -4.31115030310852 to 4.04903116529755.