Edit chart
Loading graph
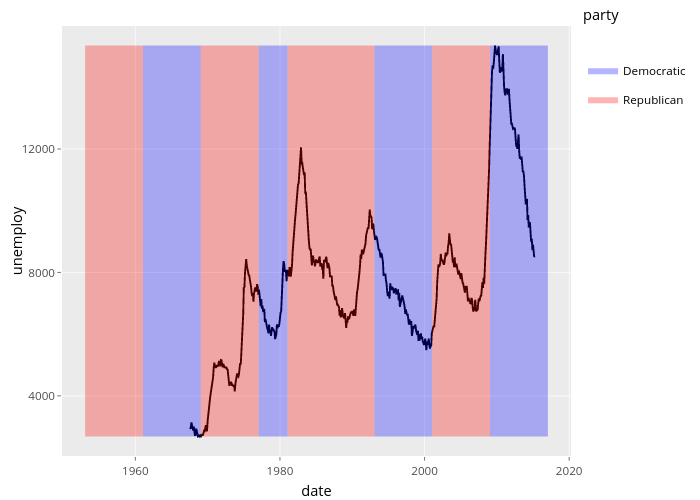
Nadhil's interactive graph and data of "unemploy vs date" is a line chart, showing Democratic vs Republican; with date in the x-axis and unemploy in the y-axis.. The x-axis shows values from -7358.8 to 18354.8. The y-axis shows values from 2051.65 to 15985.35. This visualization has the following annotation: party