GGPLOT - scale_brewer
scales provide sequential, diverging and qualitative colour schemes from ColorBrewer and then convert them with ggplotly
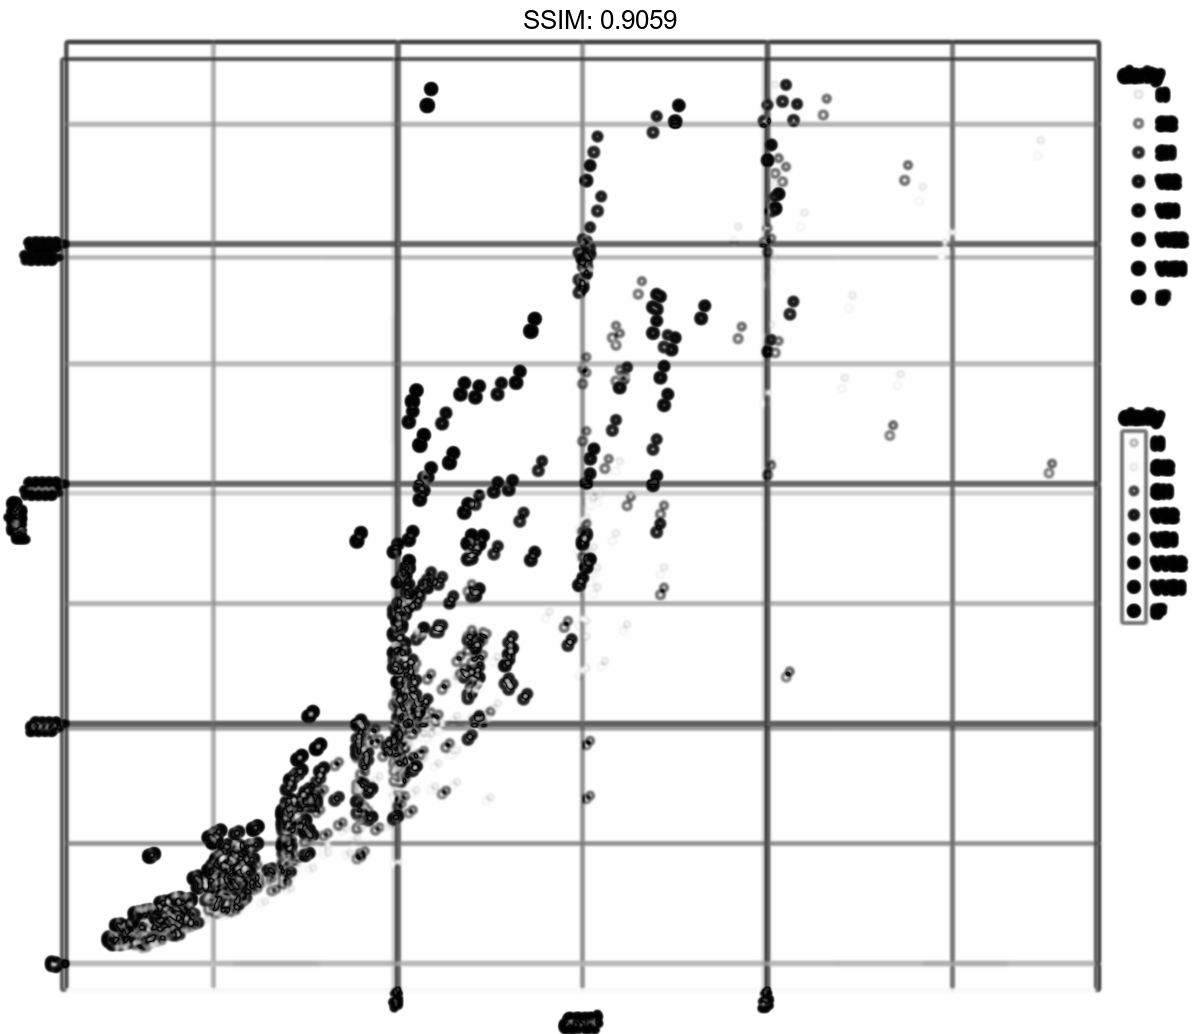
dsamp <- diamonds[sample(nrow(diamonds), 1000), ]
(d <- ggplot(dsamp, aes(carat, price)) +
  geom_point(aes(colour = clarity)))
plotly::ggplotly(d)


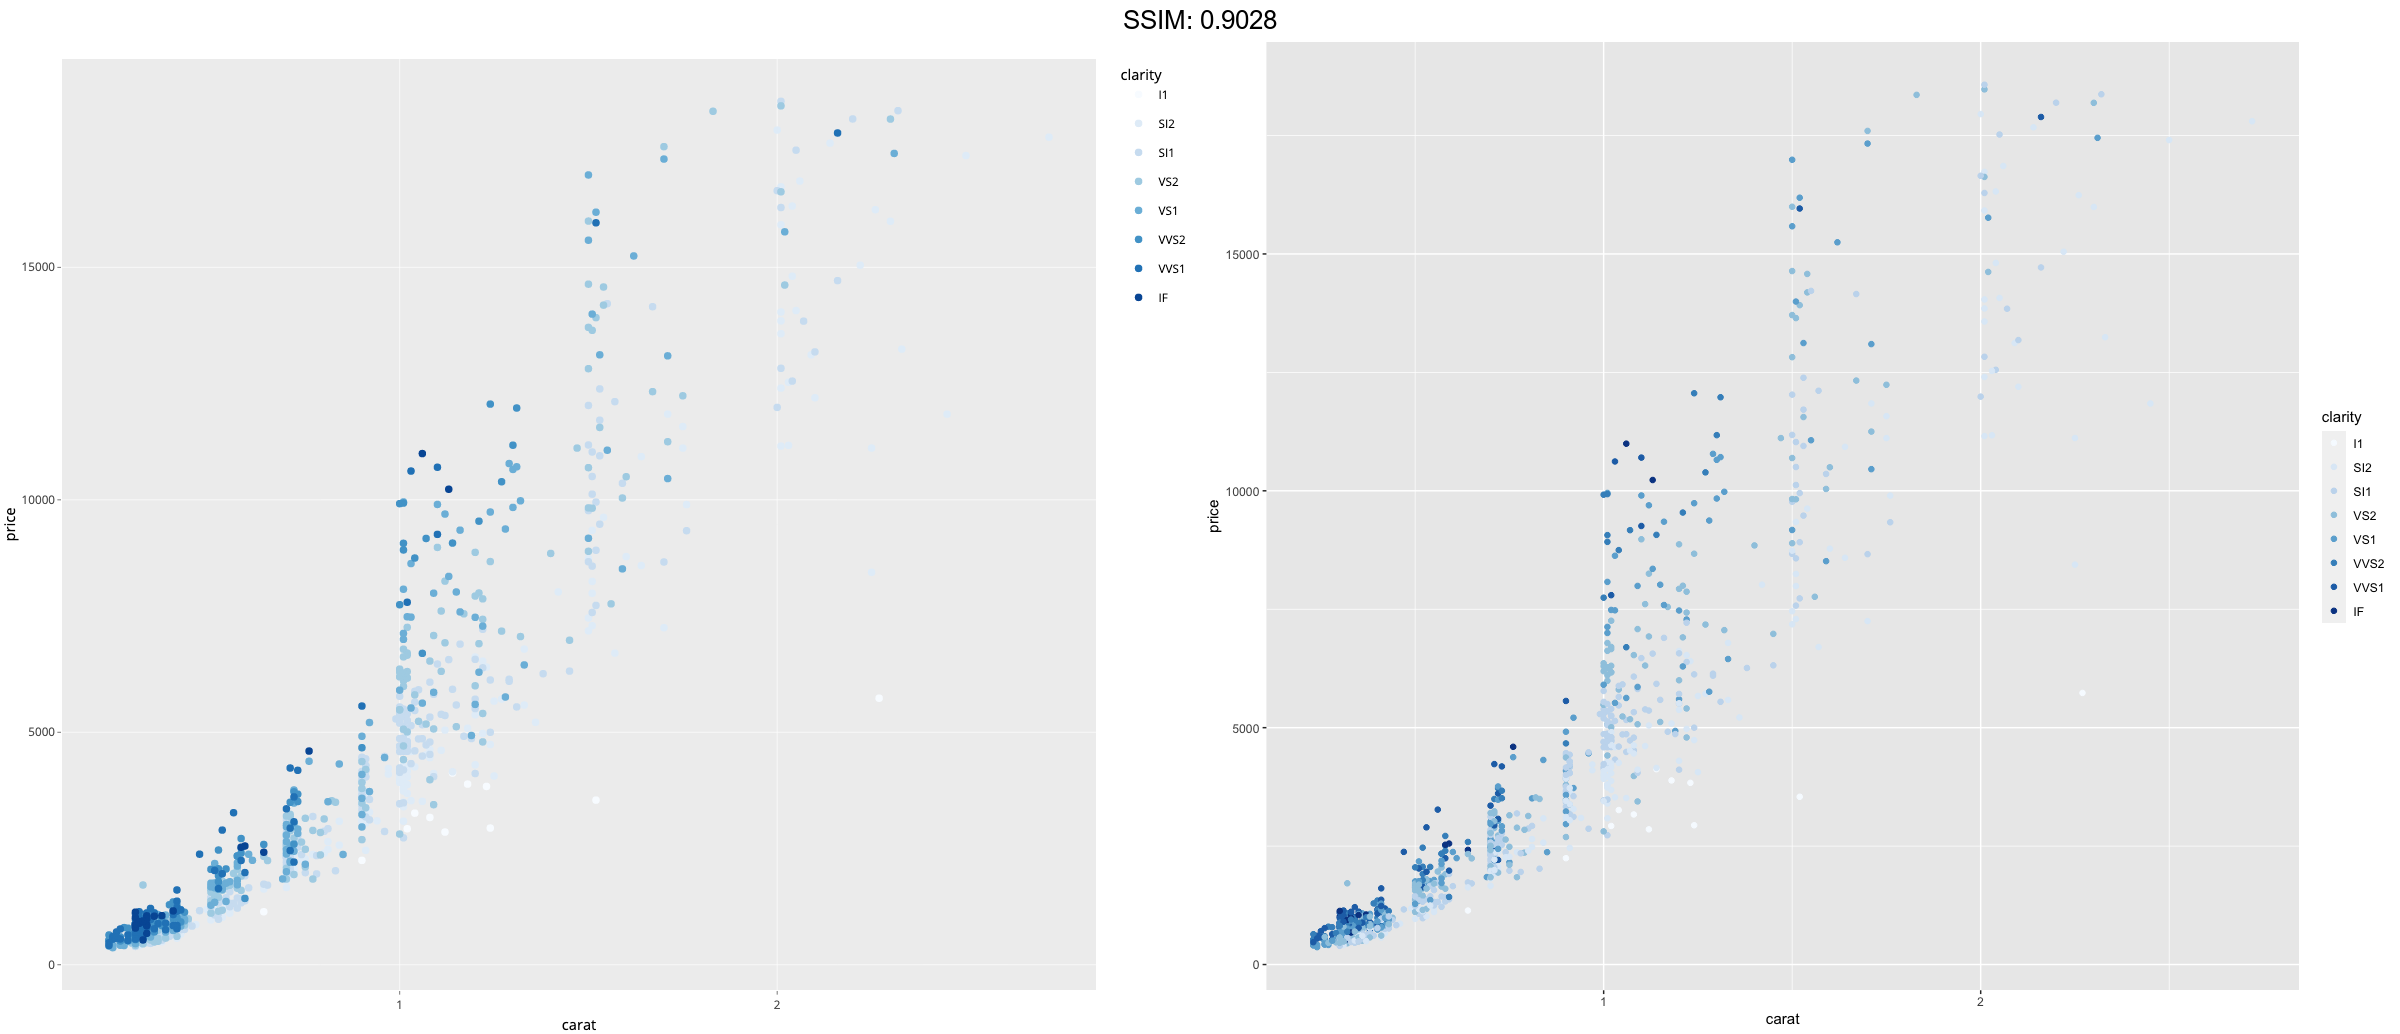
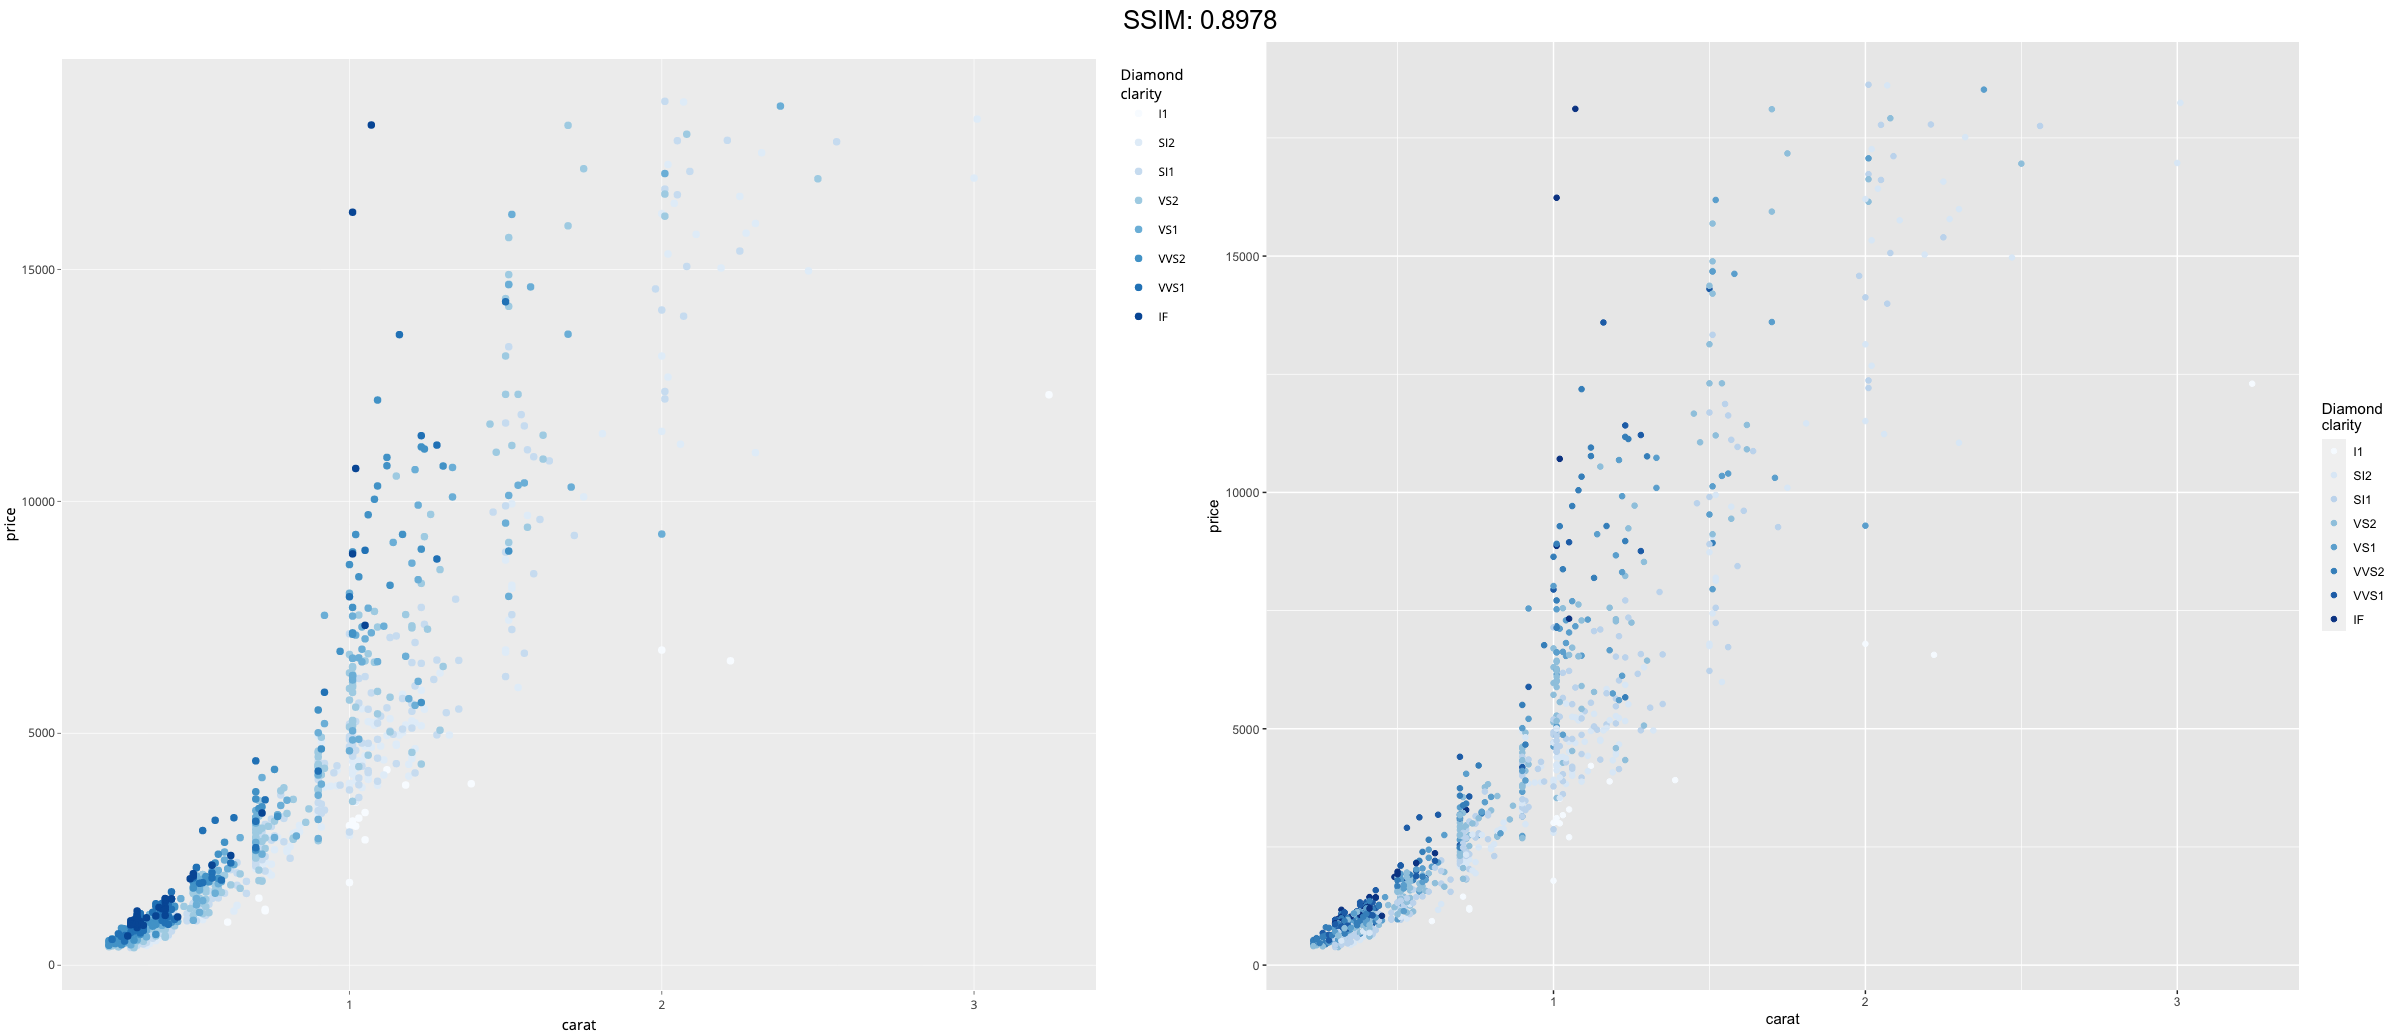
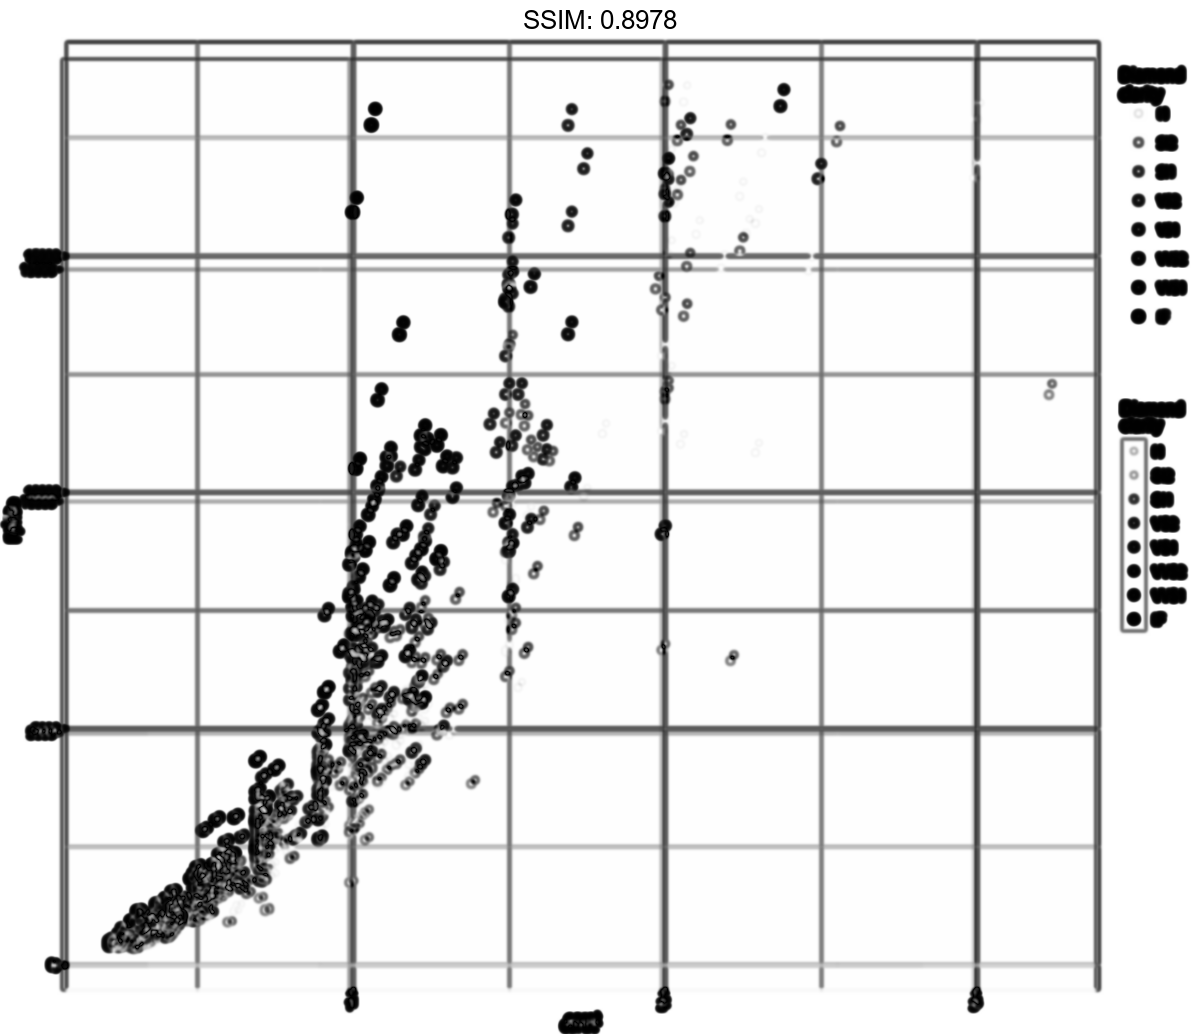
dsamp <- diamonds[sample(nrow(diamonds), 1000), ]
(d <- ggplot(dsamp, aes(carat, price)) +
  geom_point(aes(colour = clarity)))
p <-  d + scale_colour_brewer()
plotly::ggplotly(p)
dsamp <- diamonds[sample(nrow(diamonds), 1000), ]
(d <- ggplot(dsamp, aes(carat, price)) +
geom_point(aes(colour = clarity)))
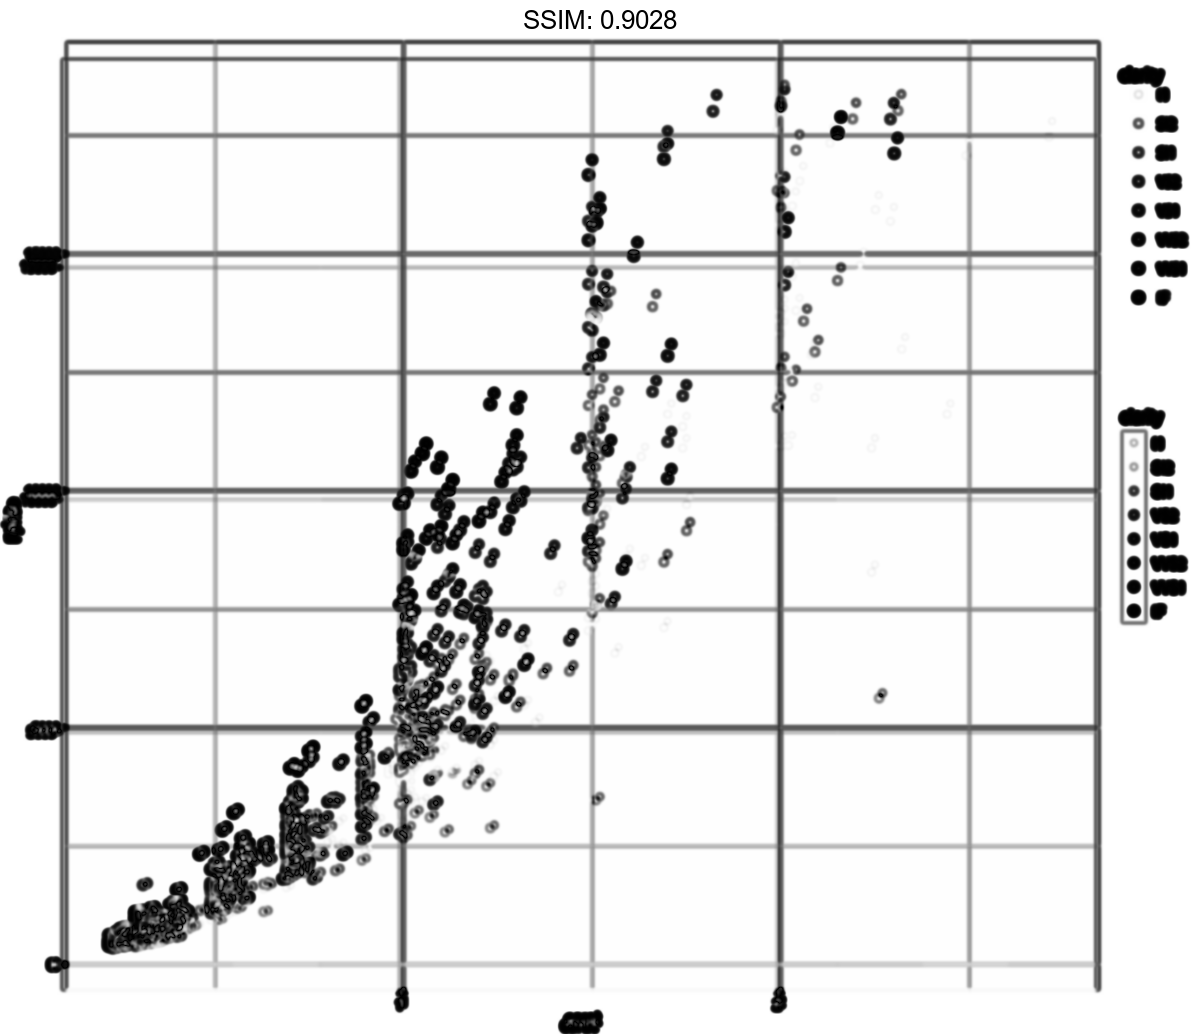
p <- d + scale_colour_brewer("Diamond\nclarity")
plotly::ggplotly(p)
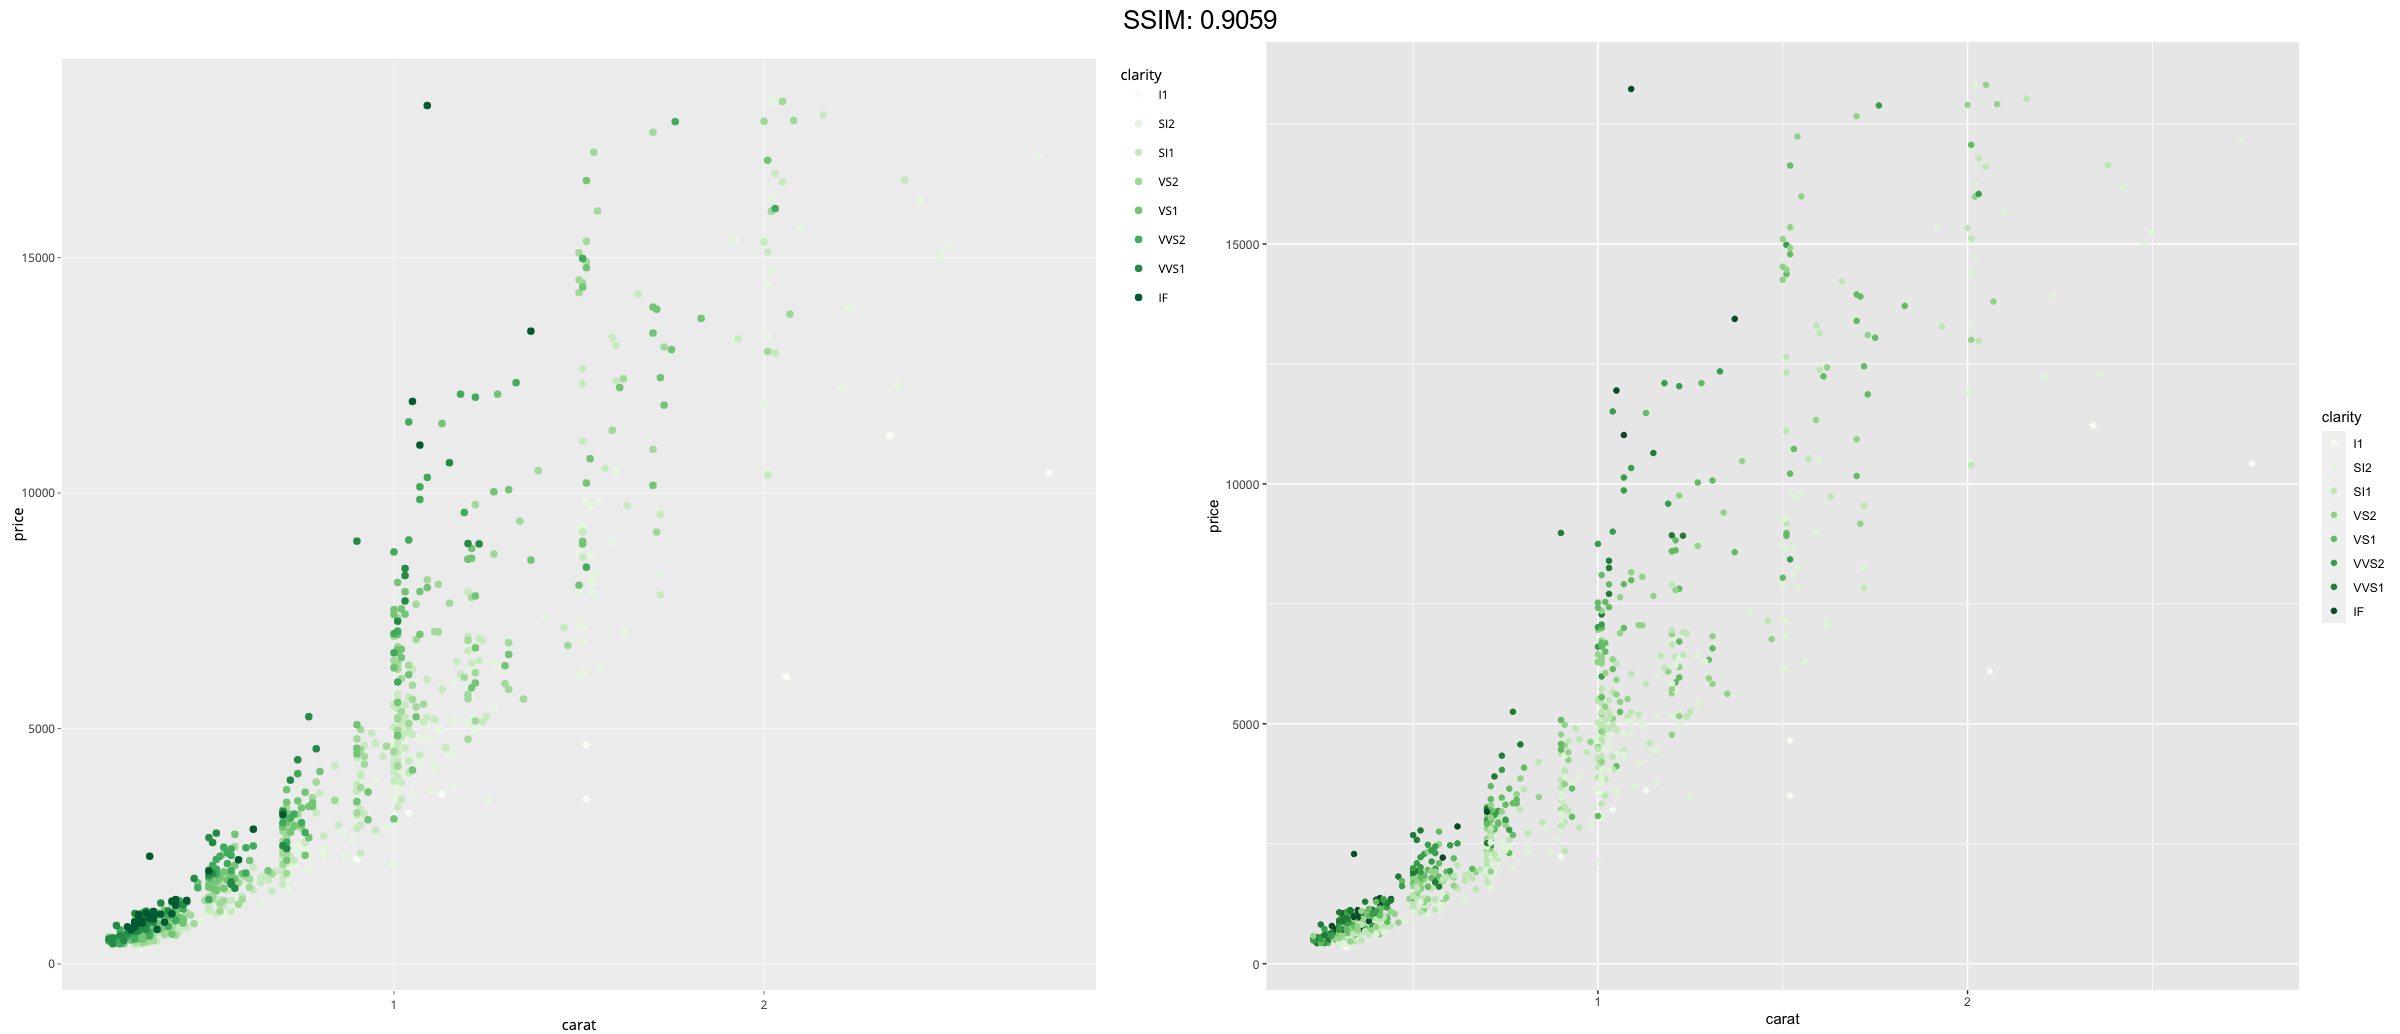
dsamp <- diamonds[sample(nrow(diamonds), 1000), ]
(d <- ggplot(dsamp, aes(carat, price)) +
  geom_point(aes(colour = clarity)))
p <-  d + scale_colour_brewer(palette = "Greens")
plotly::ggplotly(p)
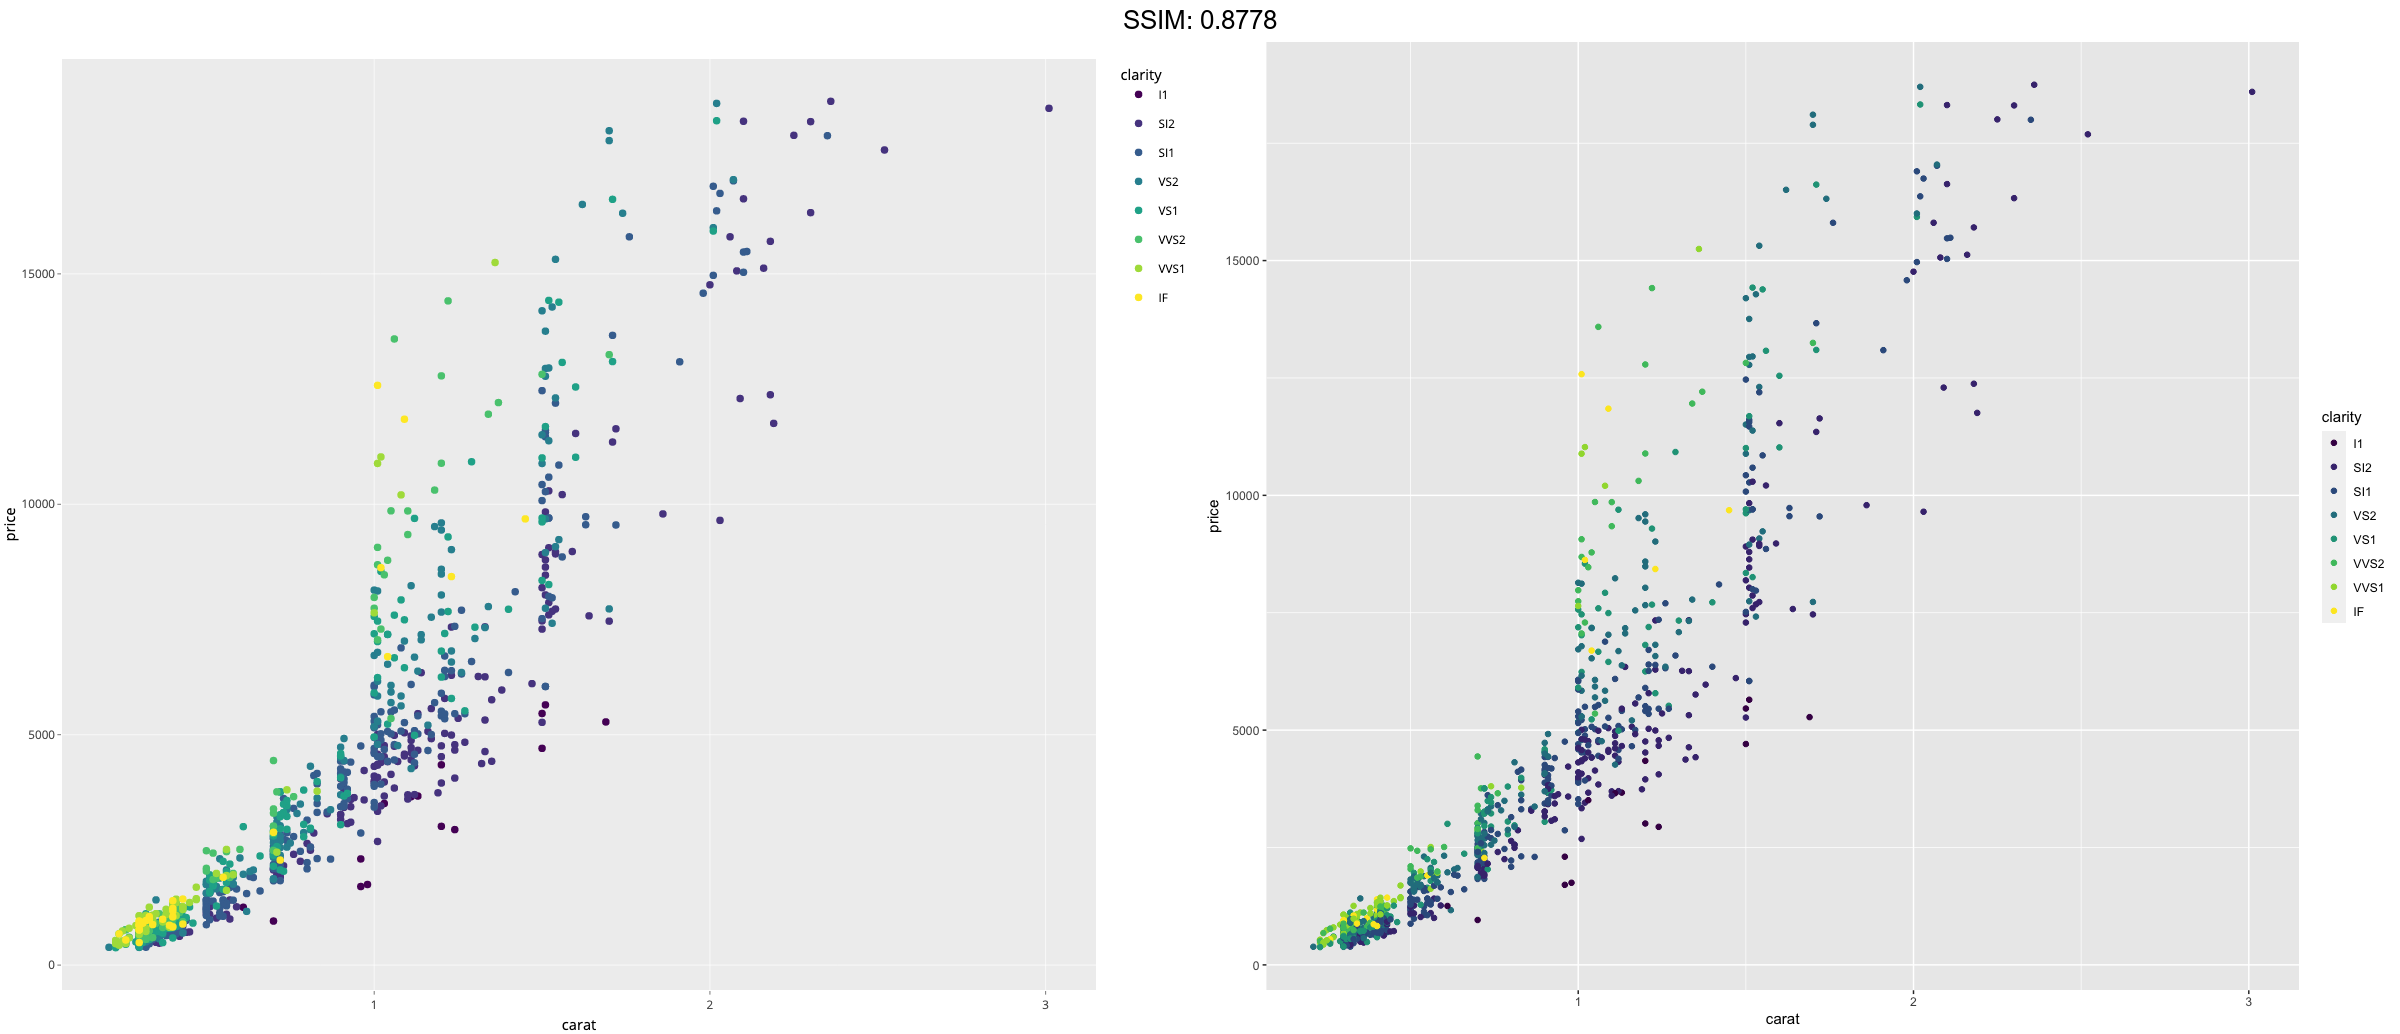
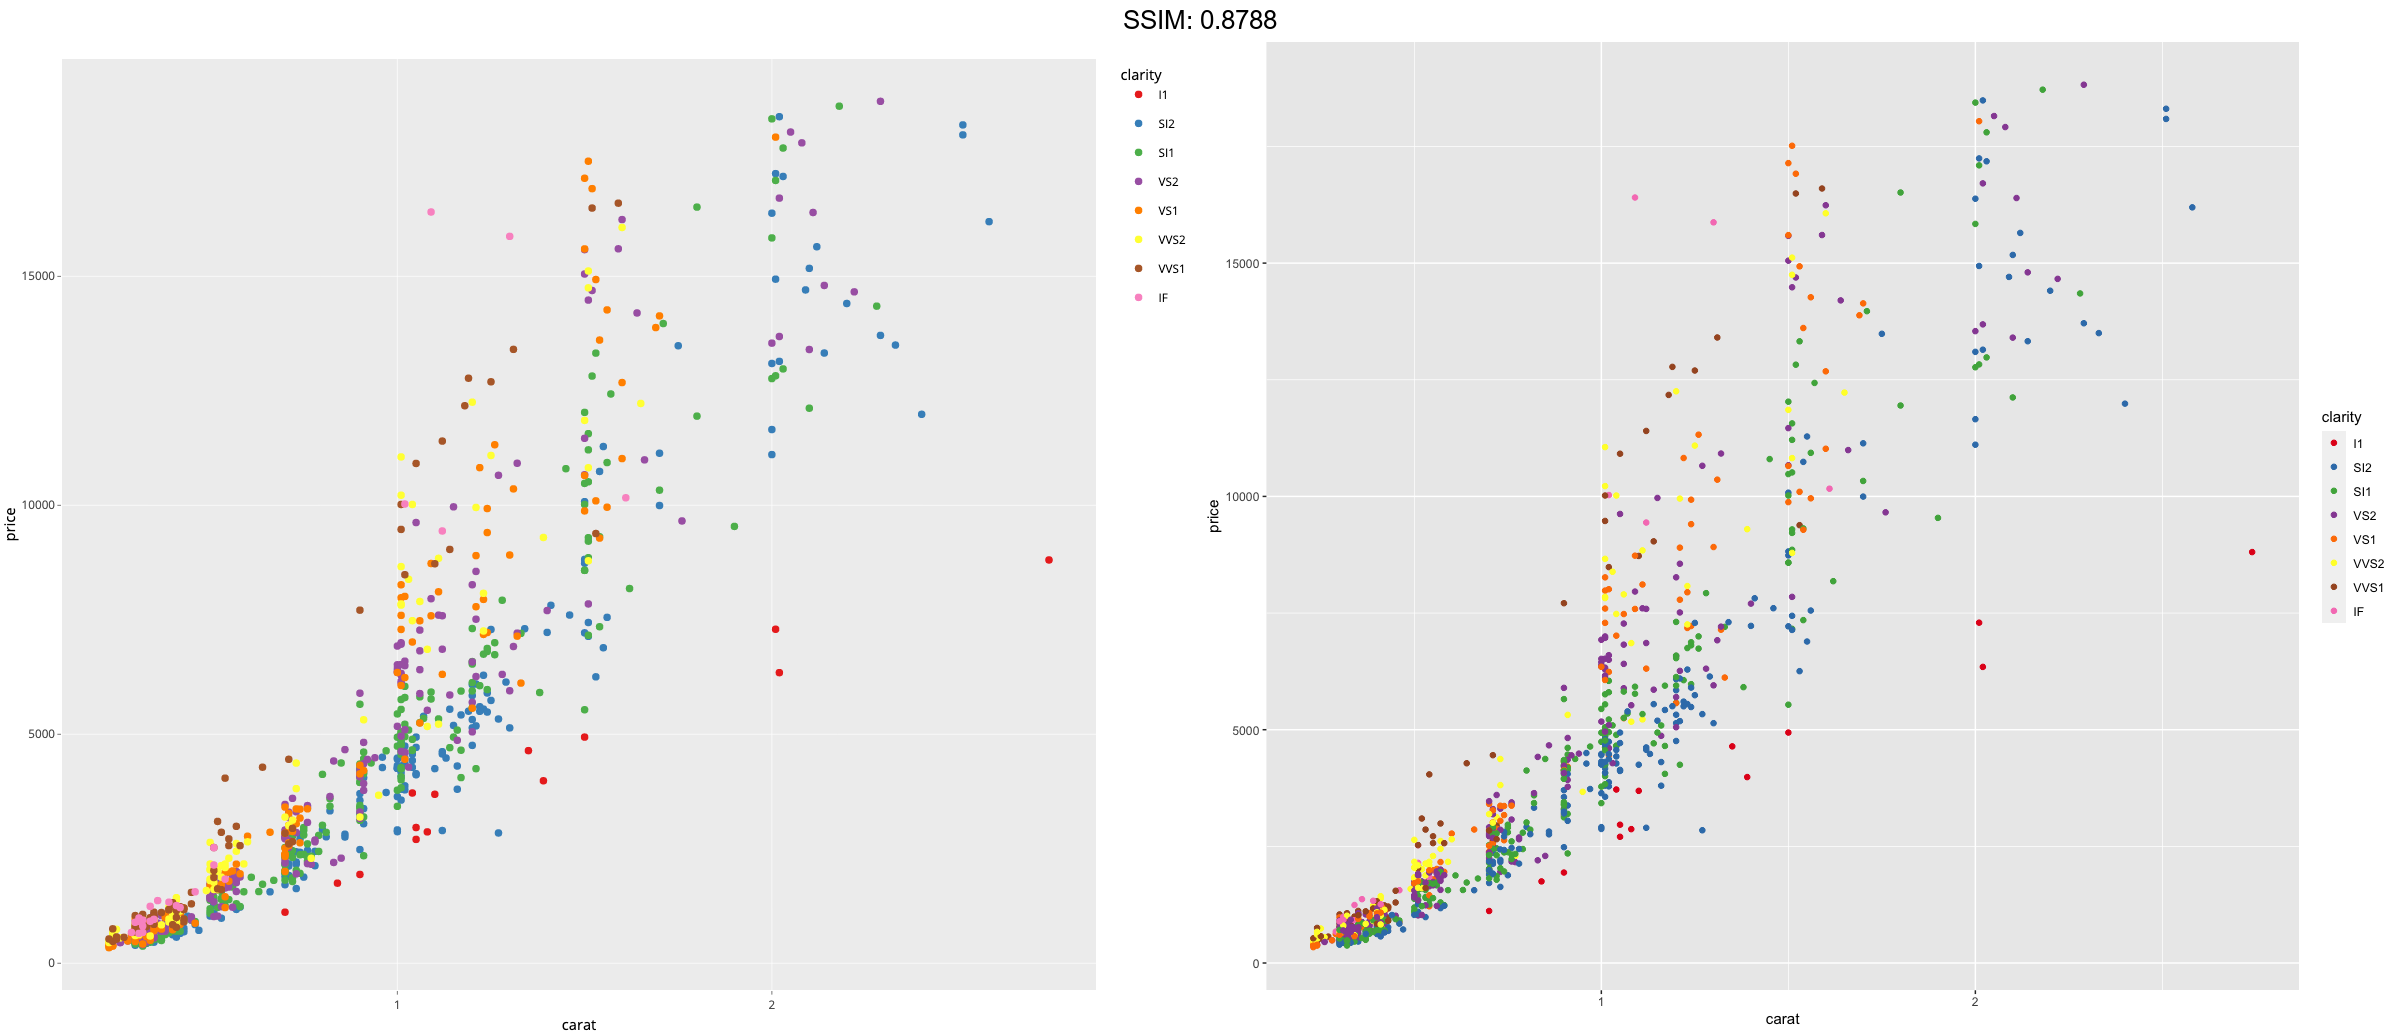
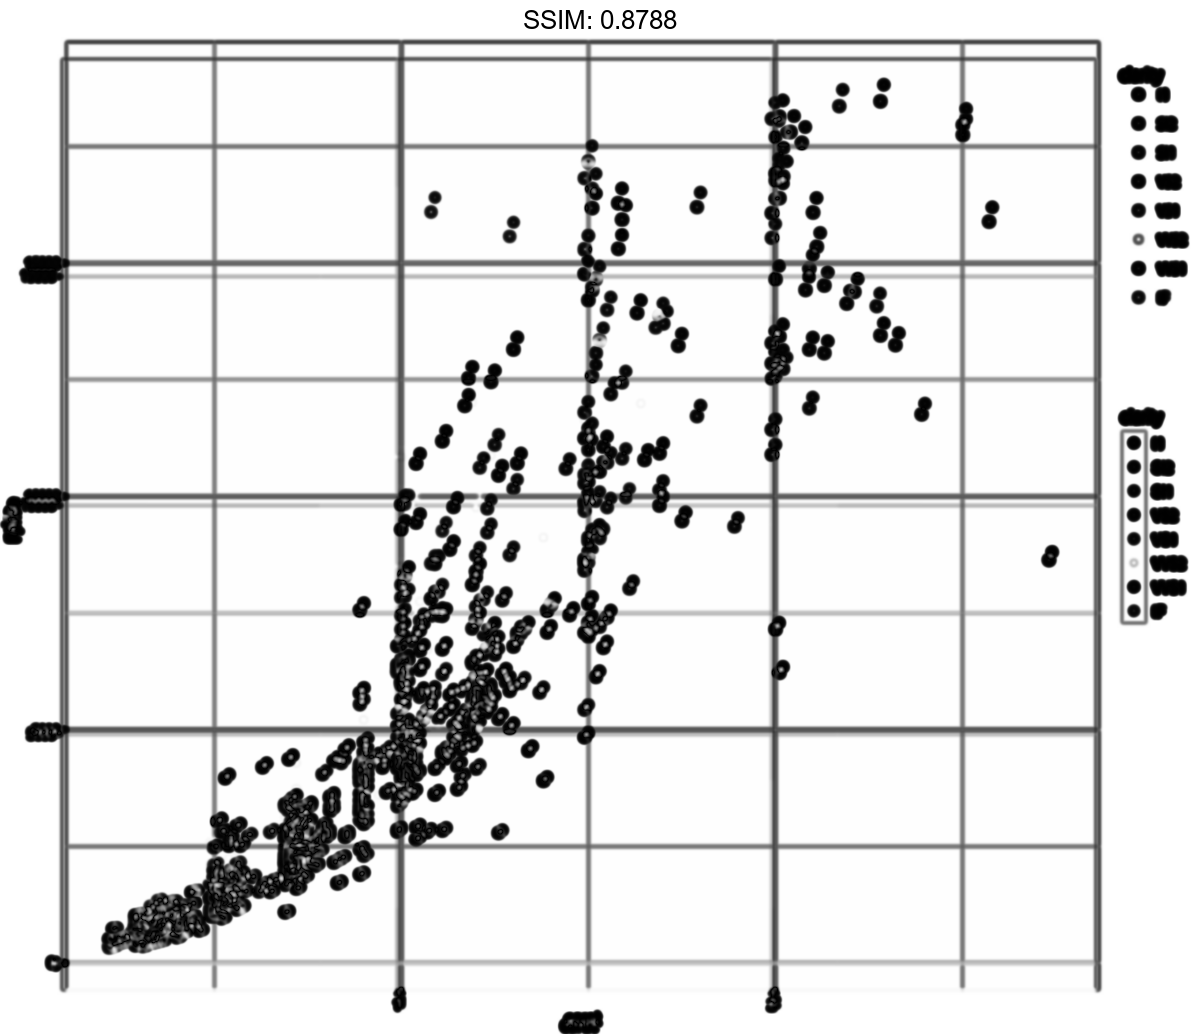
dsamp <- diamonds[sample(nrow(diamonds), 1000), ]
(d <- ggplot(dsamp, aes(carat, price)) +
  geom_point(aes(colour = clarity)))
p <-  d + scale_colour_brewer(palette = "Set1")
plotly::ggplotly(p)
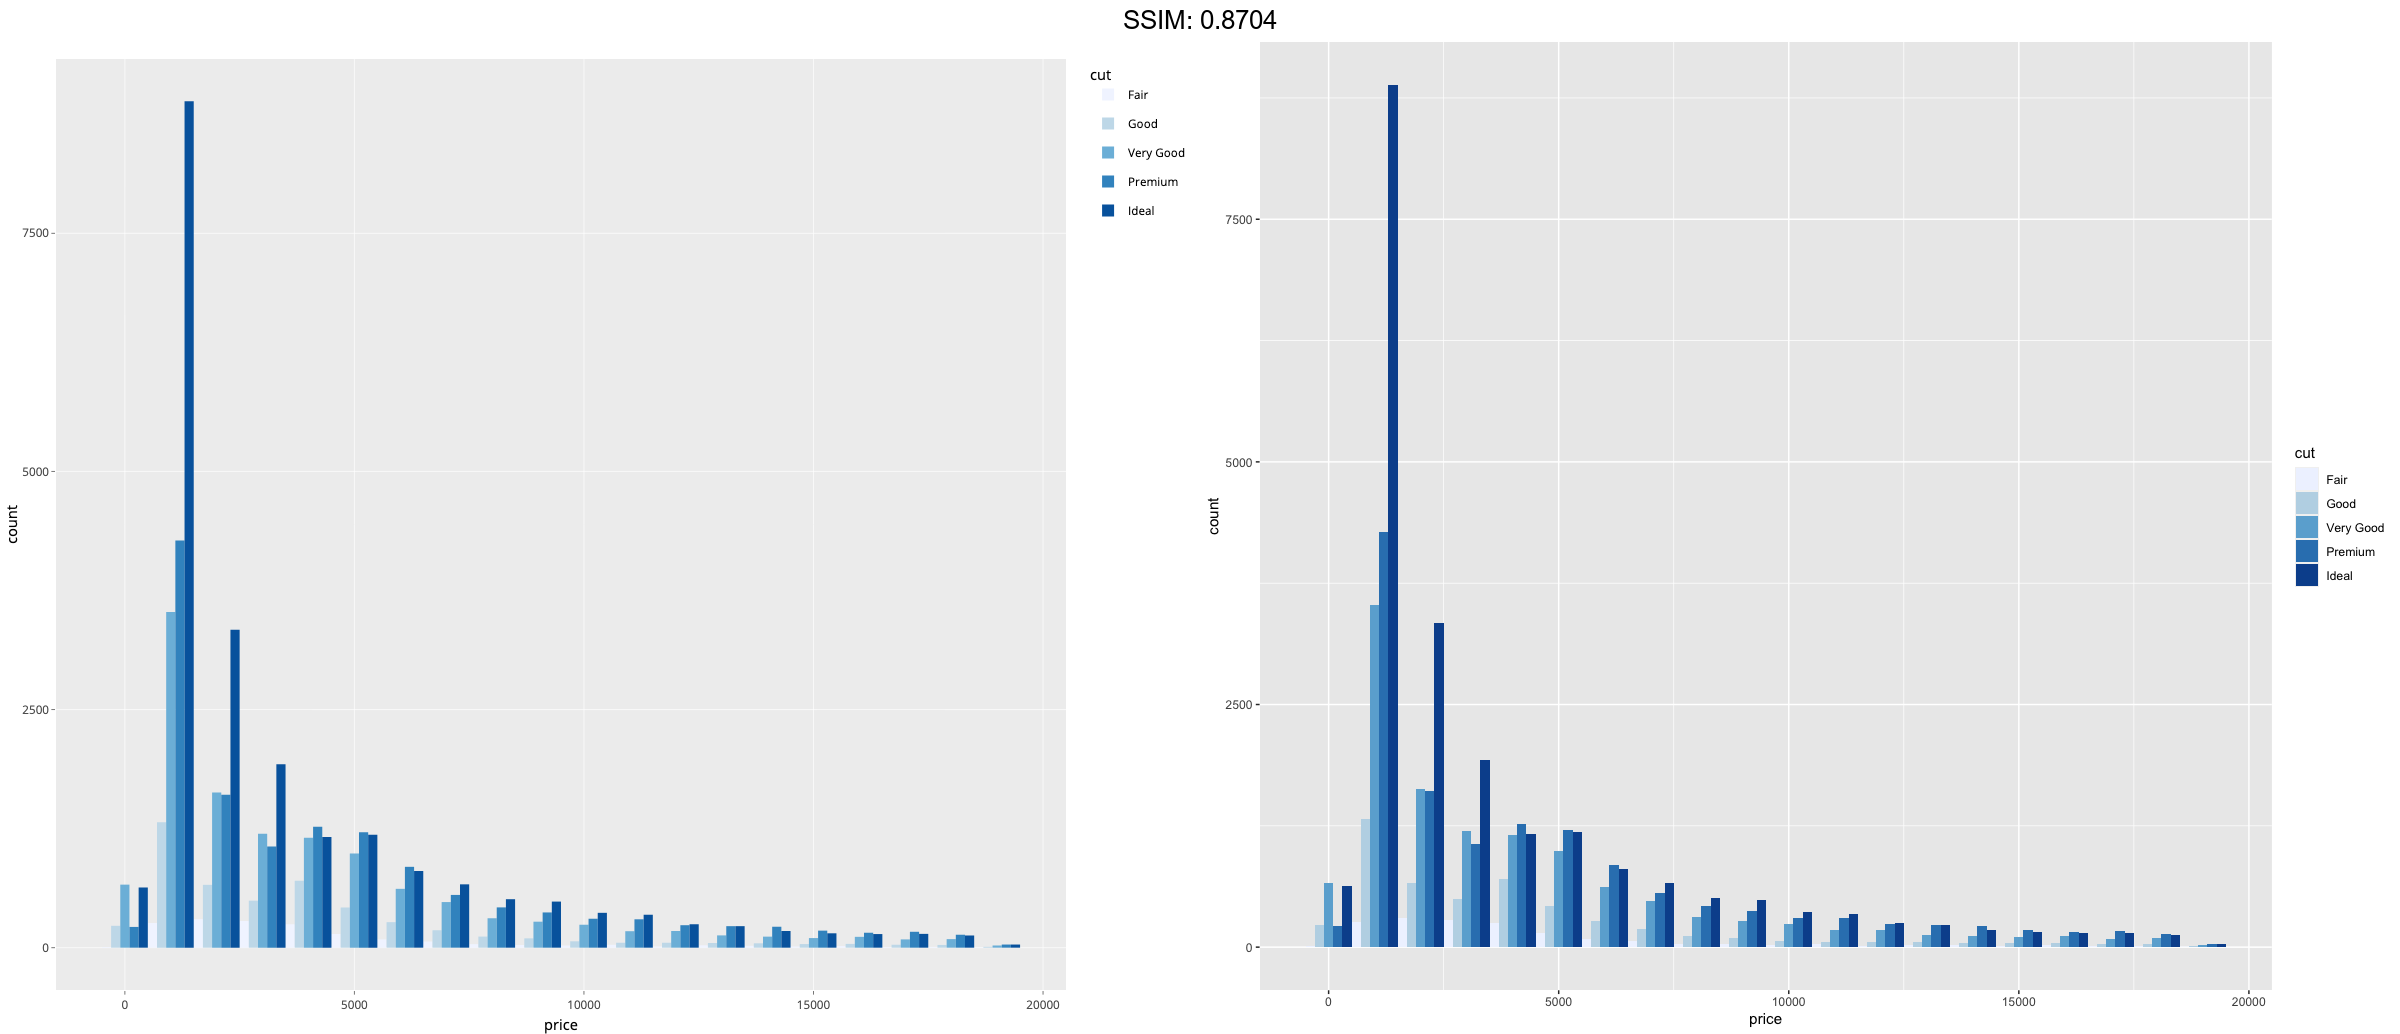
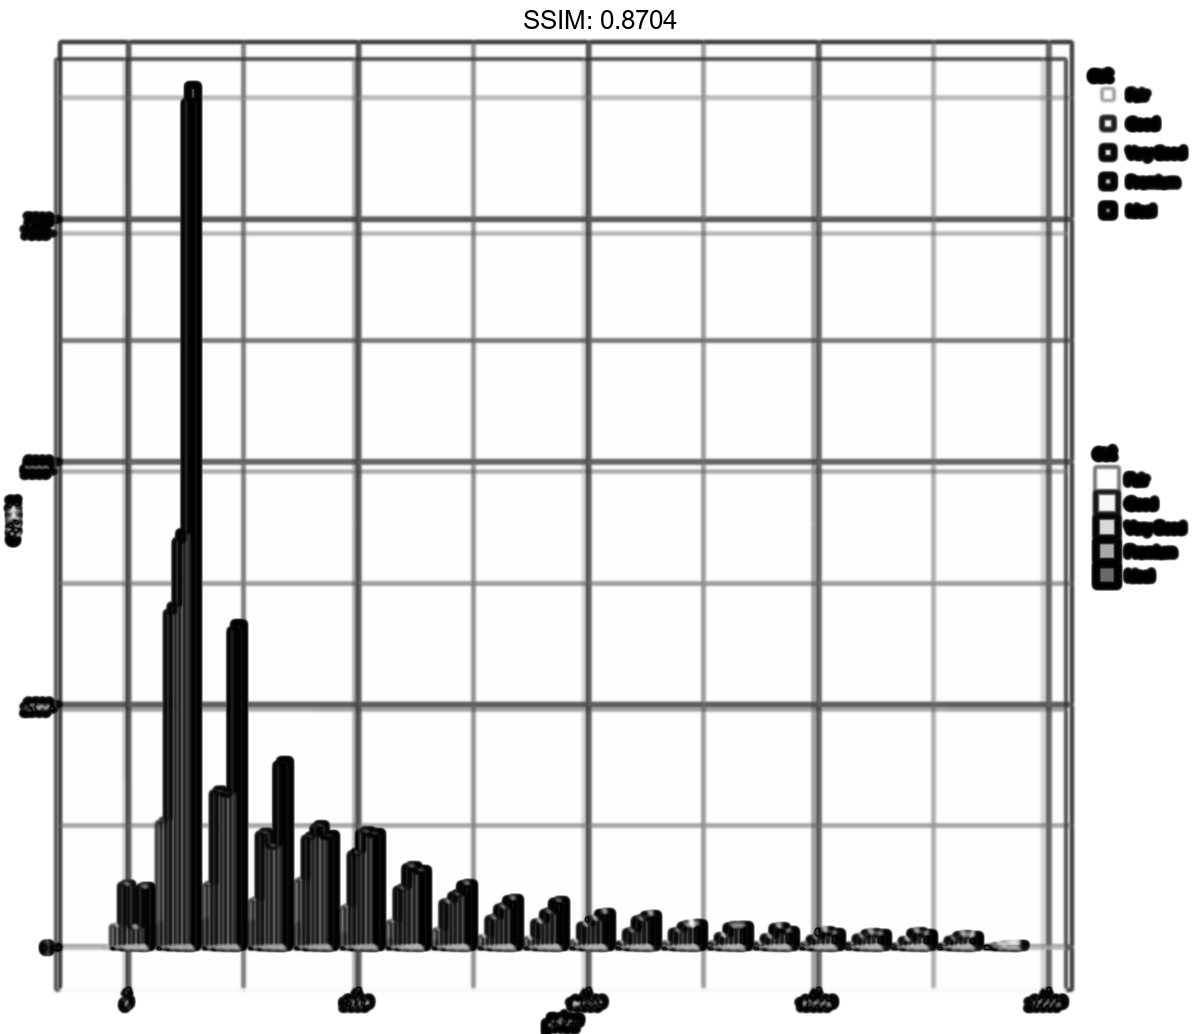
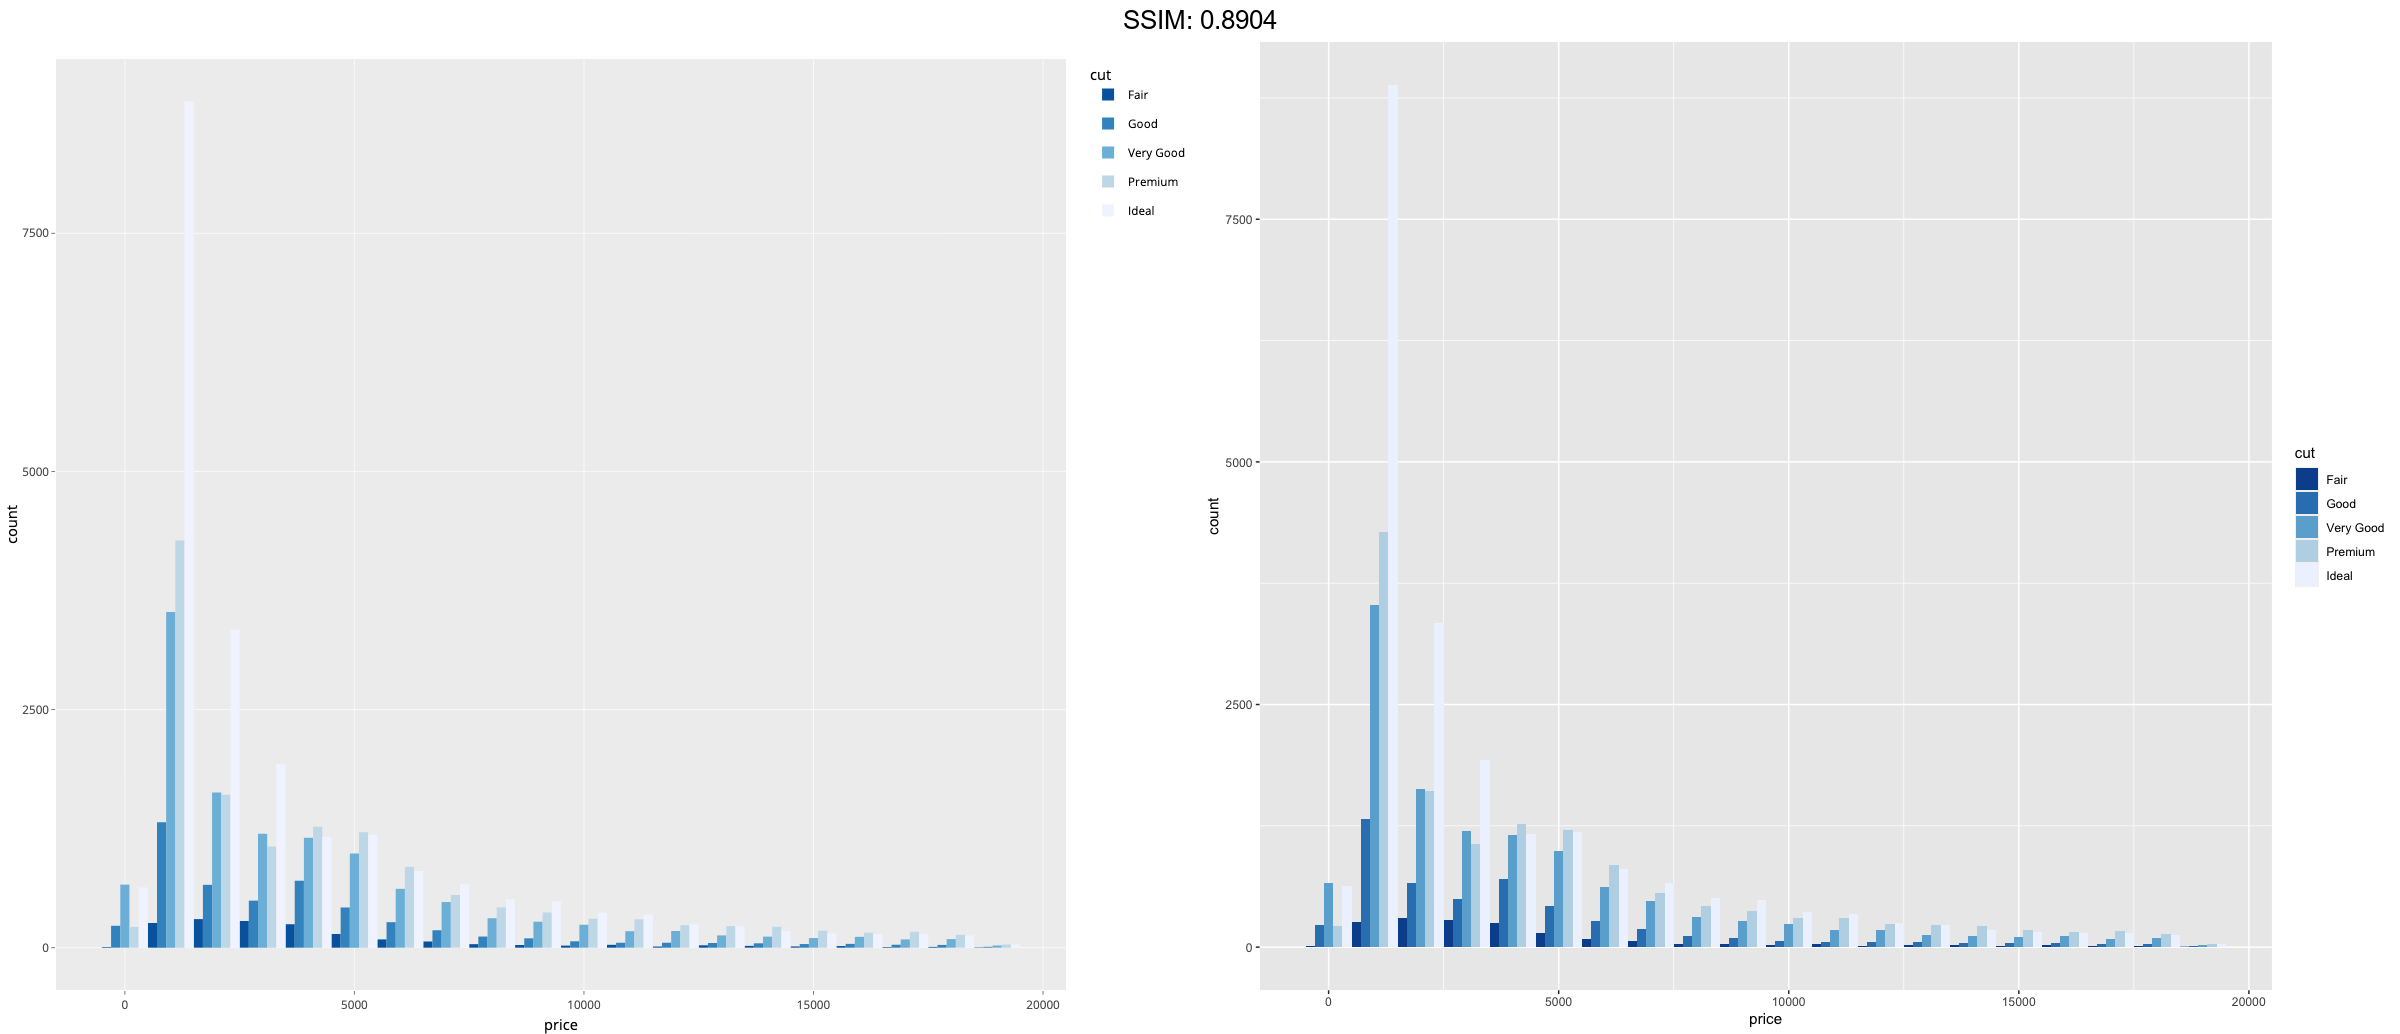
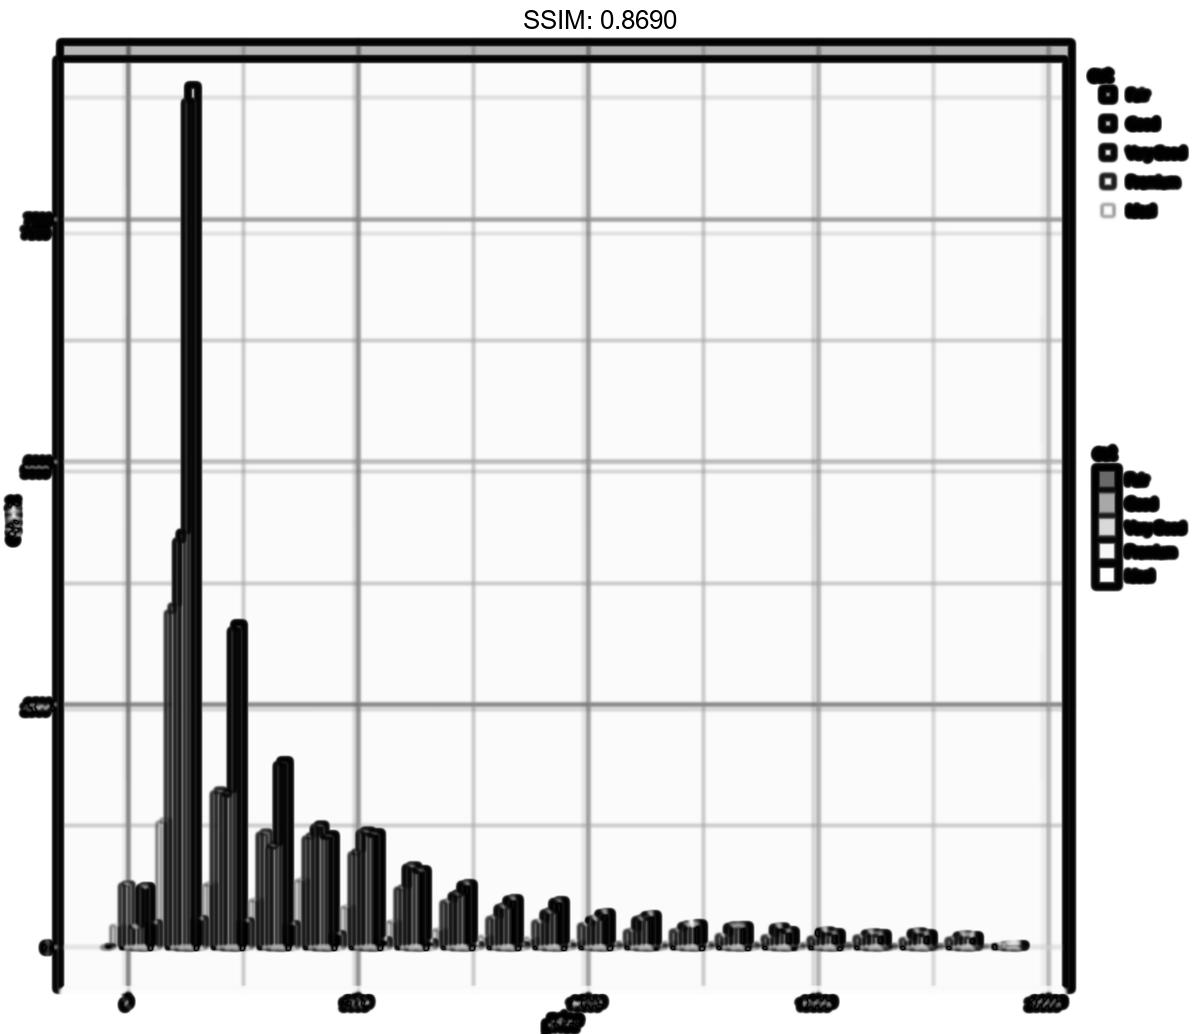
p <- ggplot(diamonds, aes(x = price, fill = cut)) +
  geom_histogram(position = "dodge", binwidth = 1000)
p <-  p + scale_fill_brewer()
plotly::ggplotly(p)
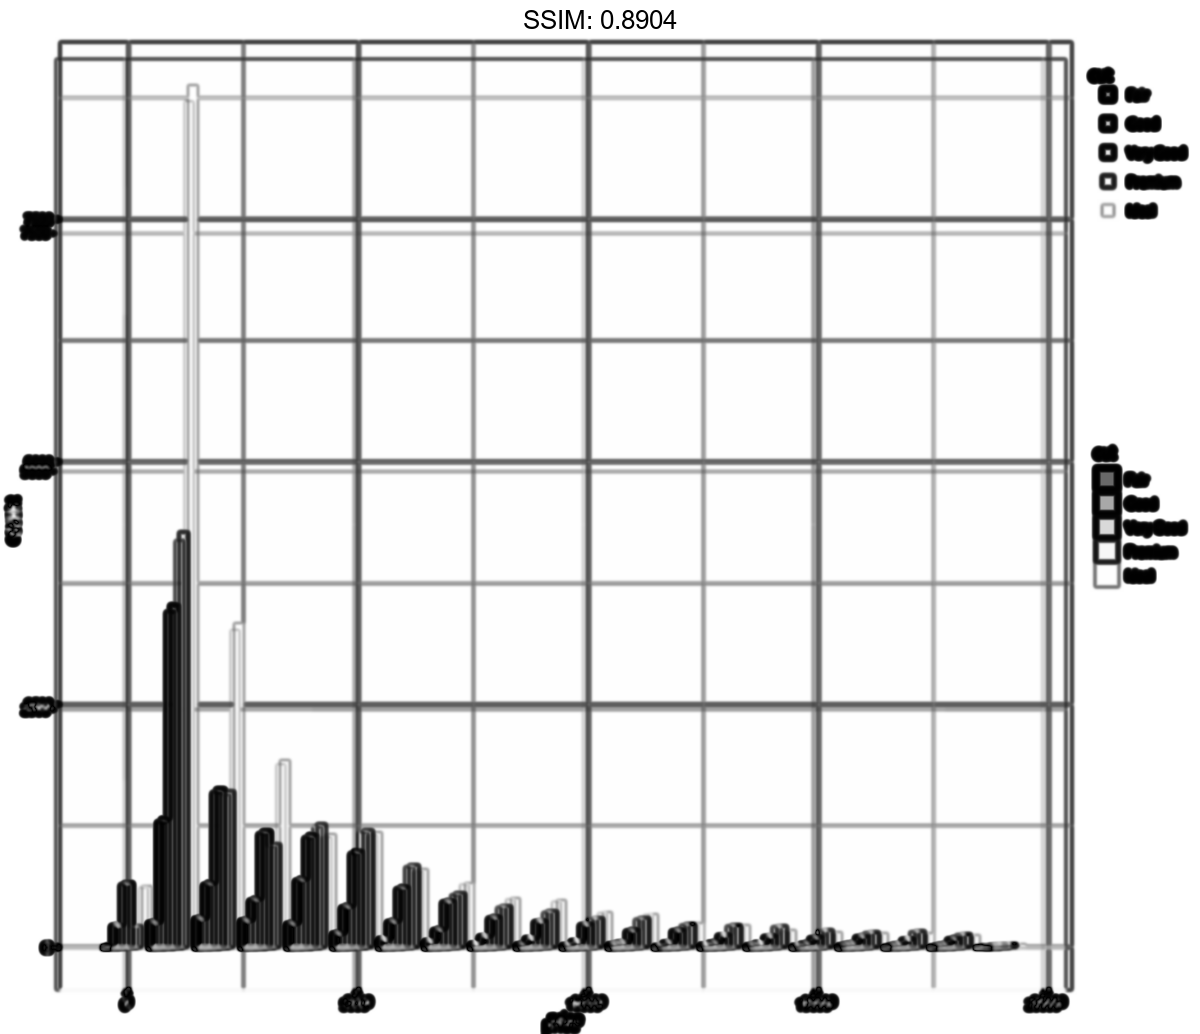
p <- ggplot(diamonds, aes(x = price, fill = cut)) +
  geom_histogram(position = "dodge", binwidth = 1000)
p <-  p + scale_fill_brewer(direction = -1)
plotly::ggplotly(p)
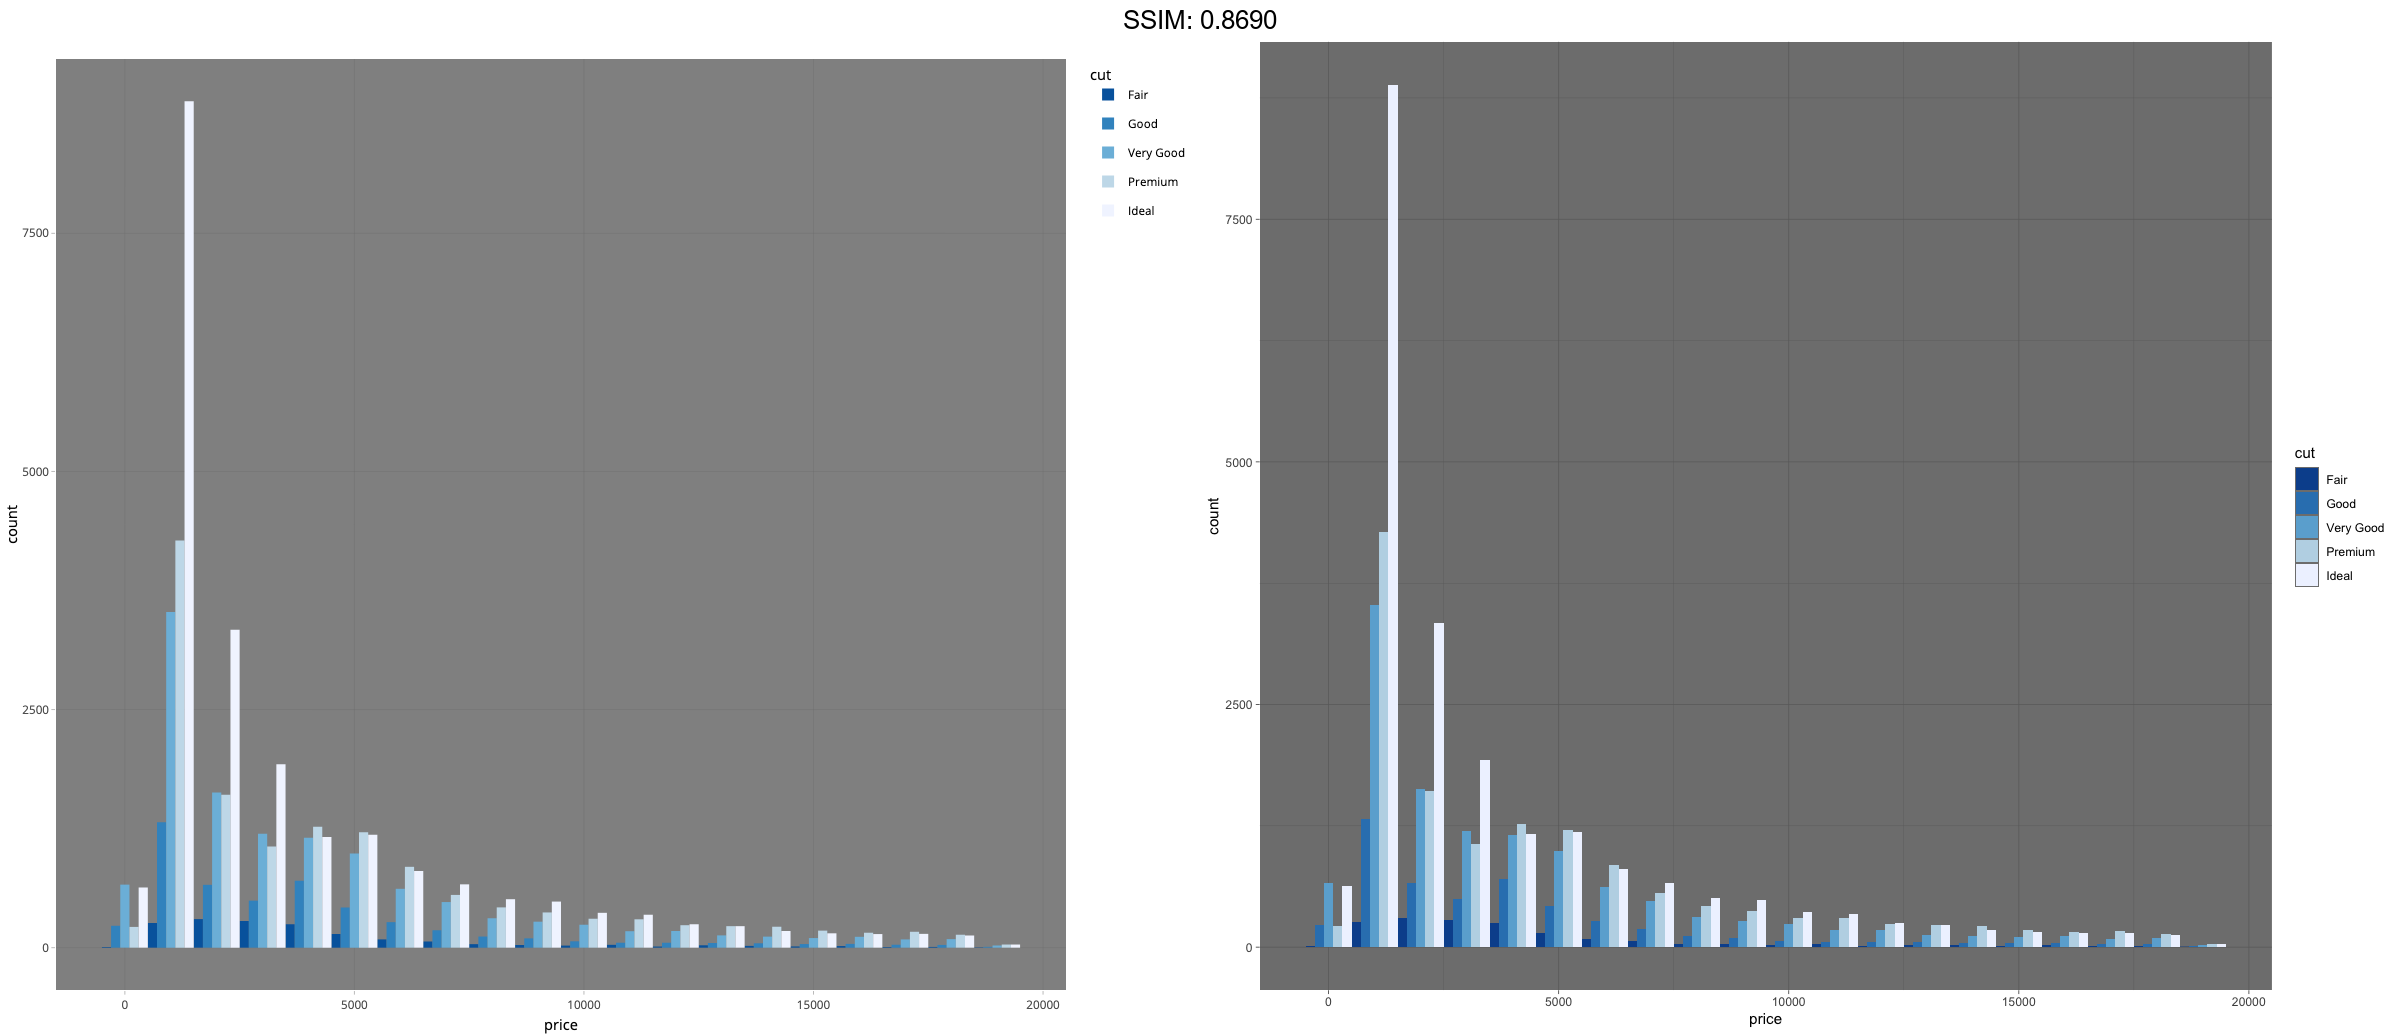
p <- ggplot(diamonds, aes(x = price, fill = cut)) +
  geom_histogram(position = "dodge", binwidth = 1000)
p <-
 p +
  scale_fill_brewer(direction = -1) +
  theme_dark()
plotly::ggplotly(p)
v <- ggplot(faithfuld) +
  geom_tile(aes(waiting, eruptions, fill = density))
plotly::ggplotly(v)
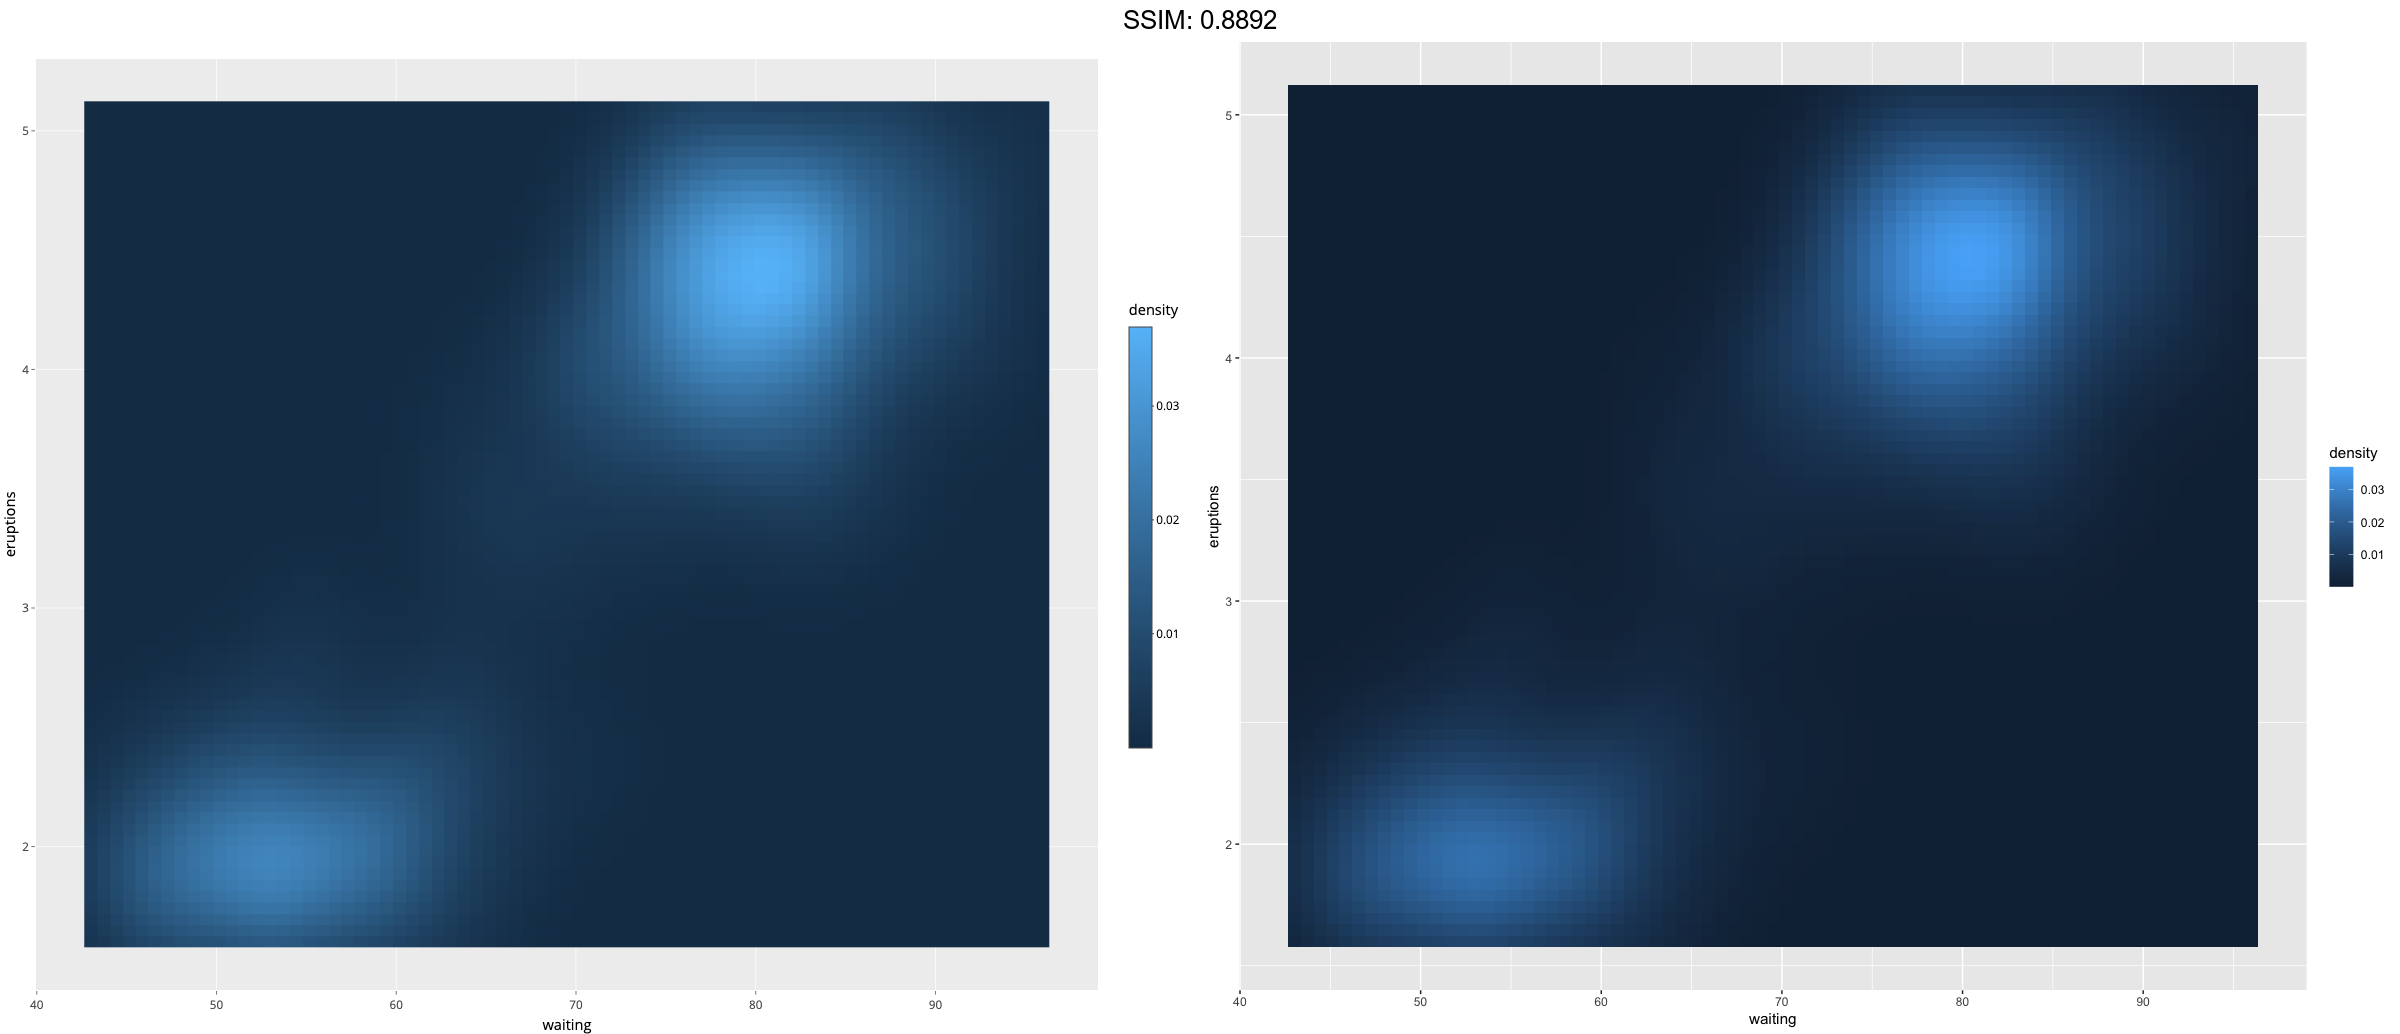
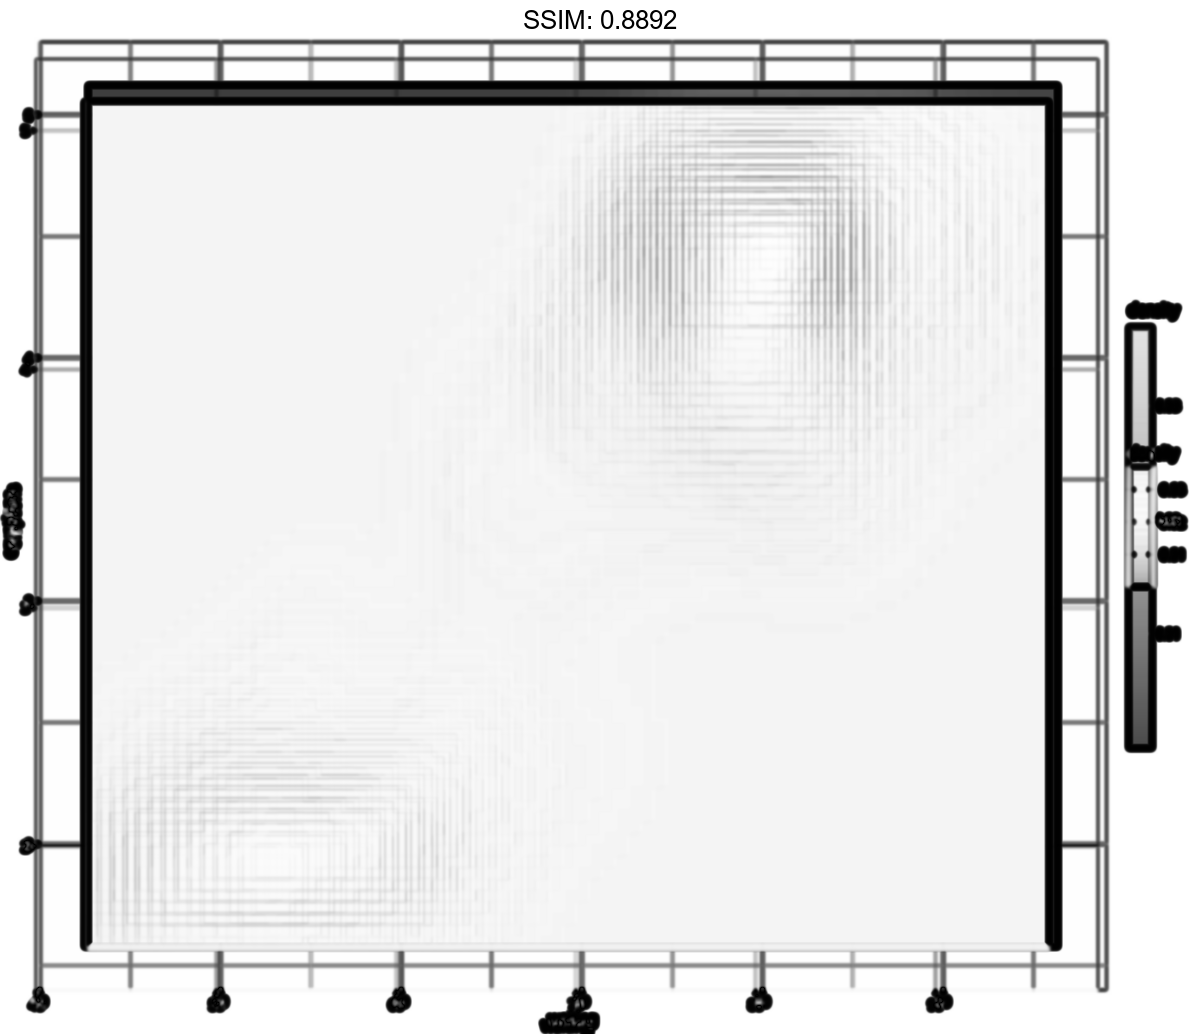
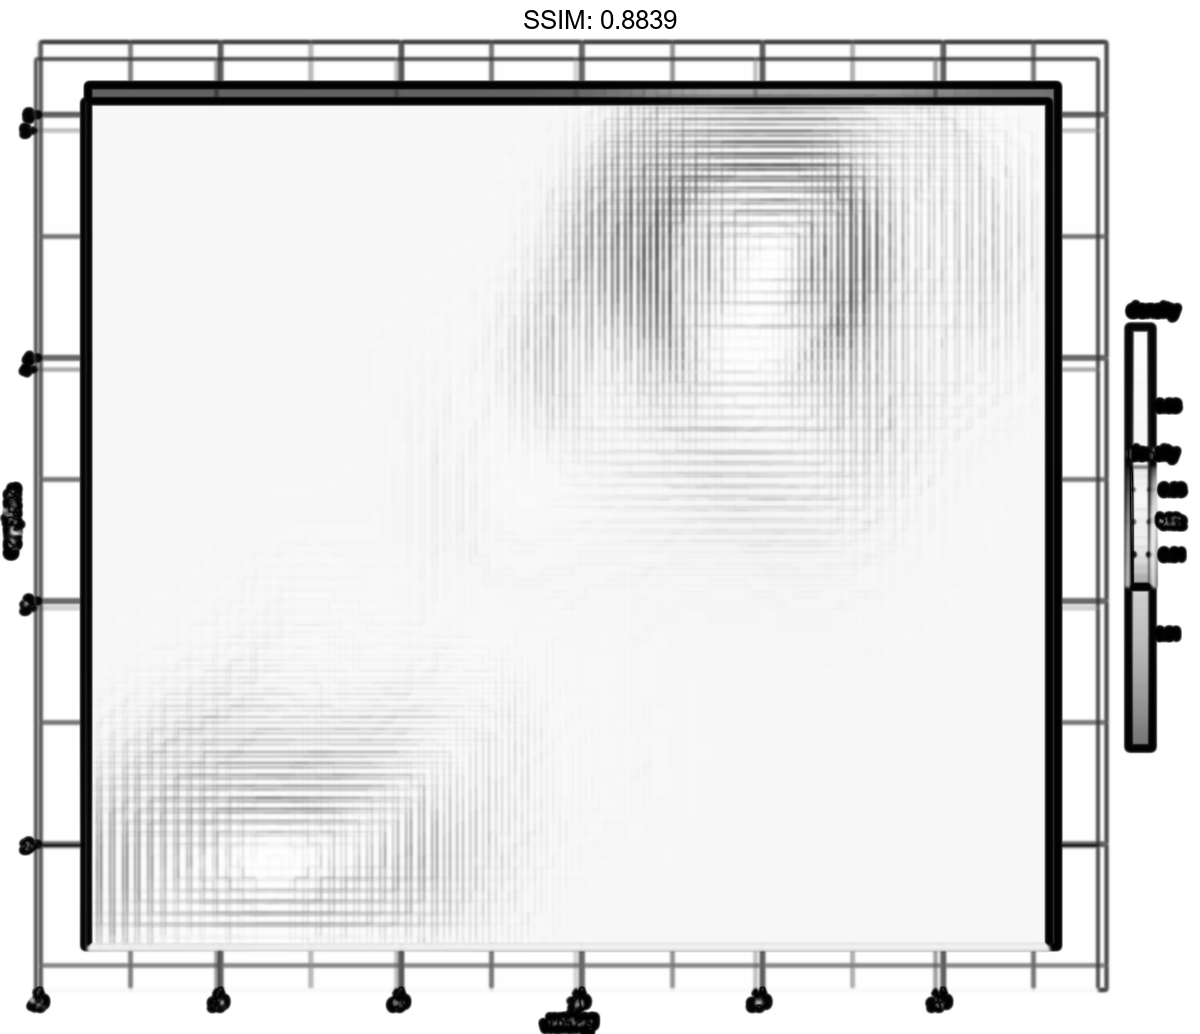
v <- ggplot(faithfuld) +
  geom_tile(aes(waiting, eruptions, fill = density))
p <-  v + scale_fill_distiller()
plotly::ggplotly(p)
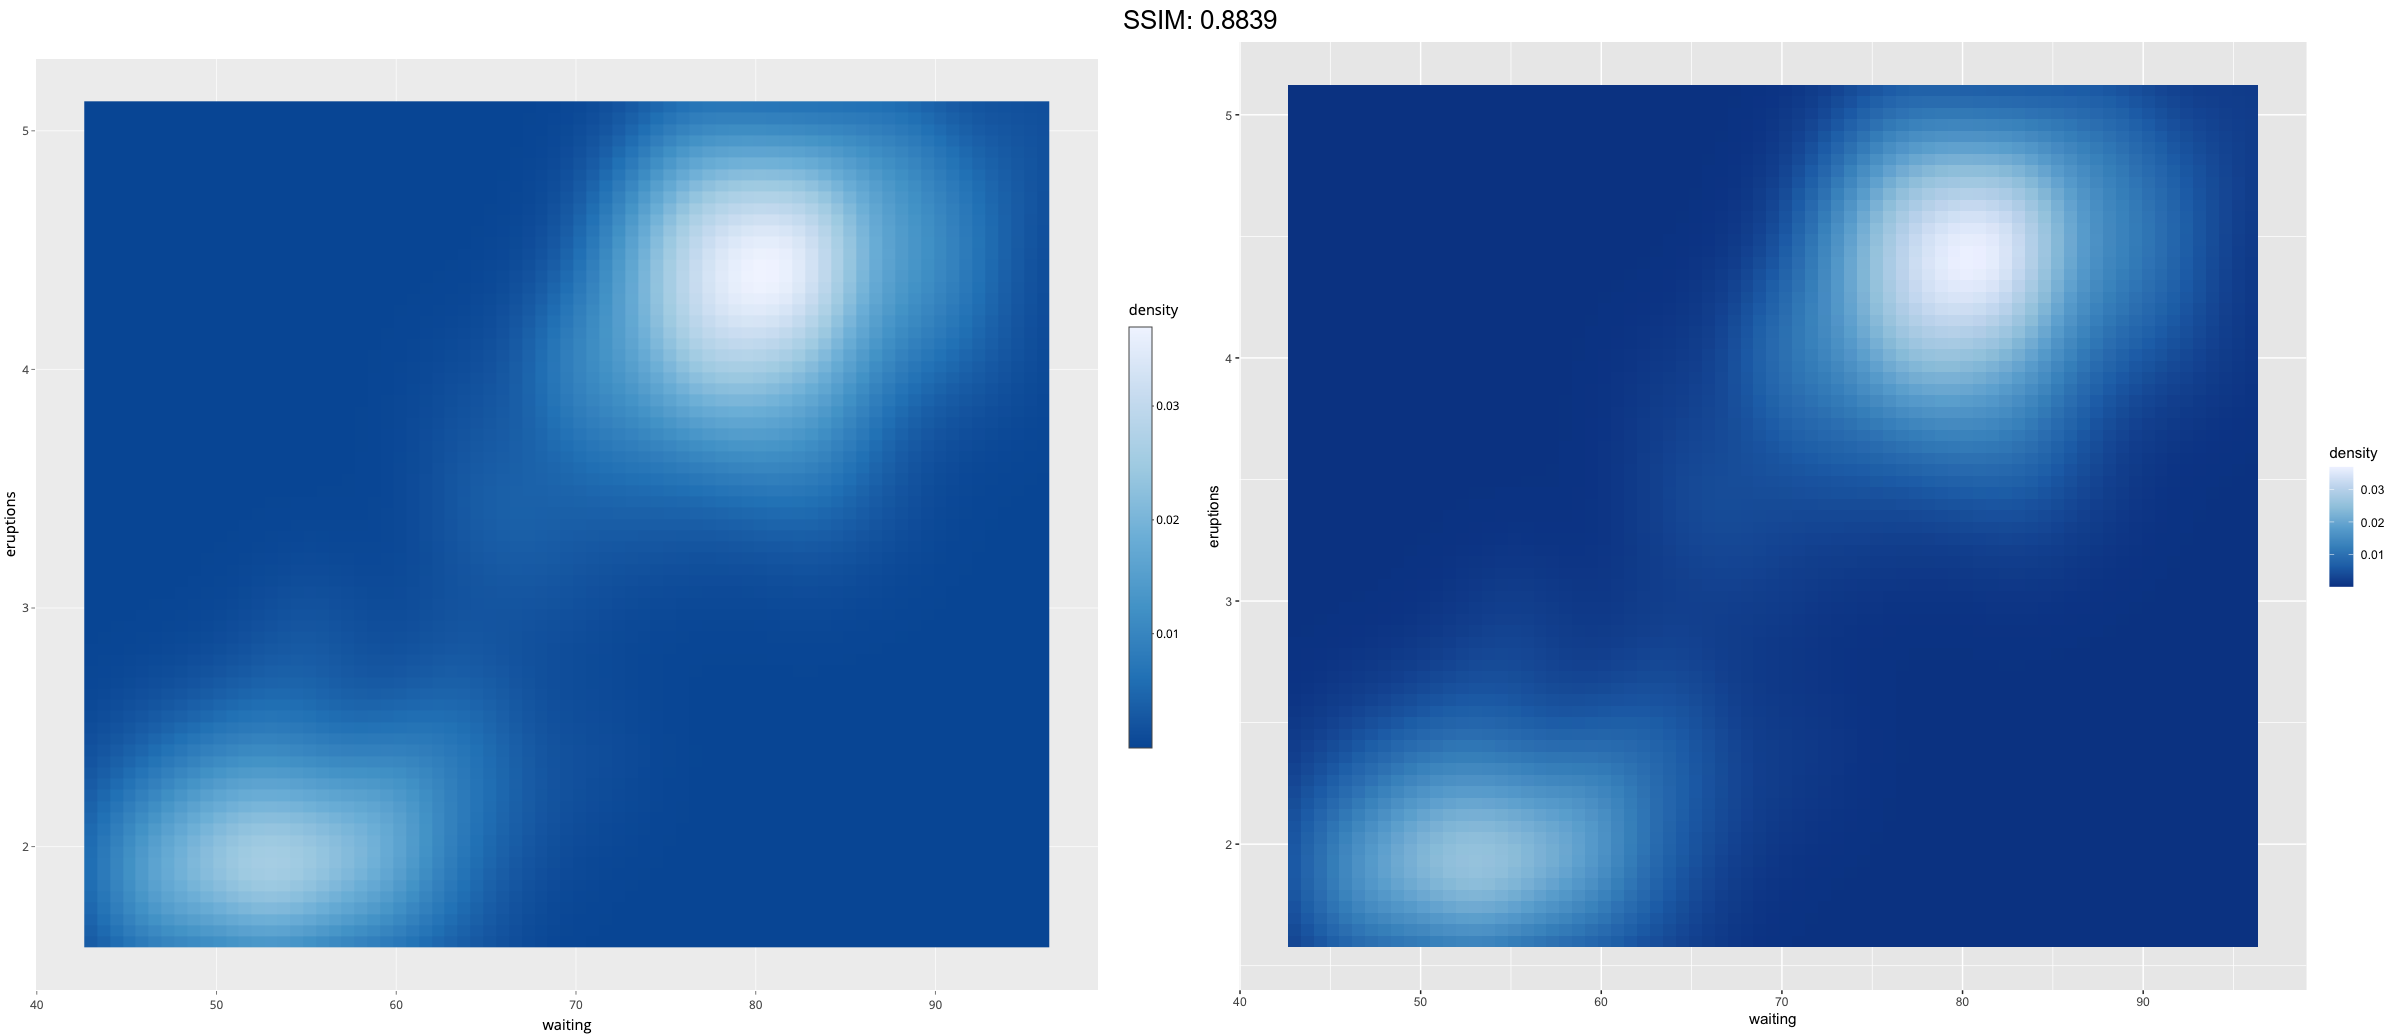
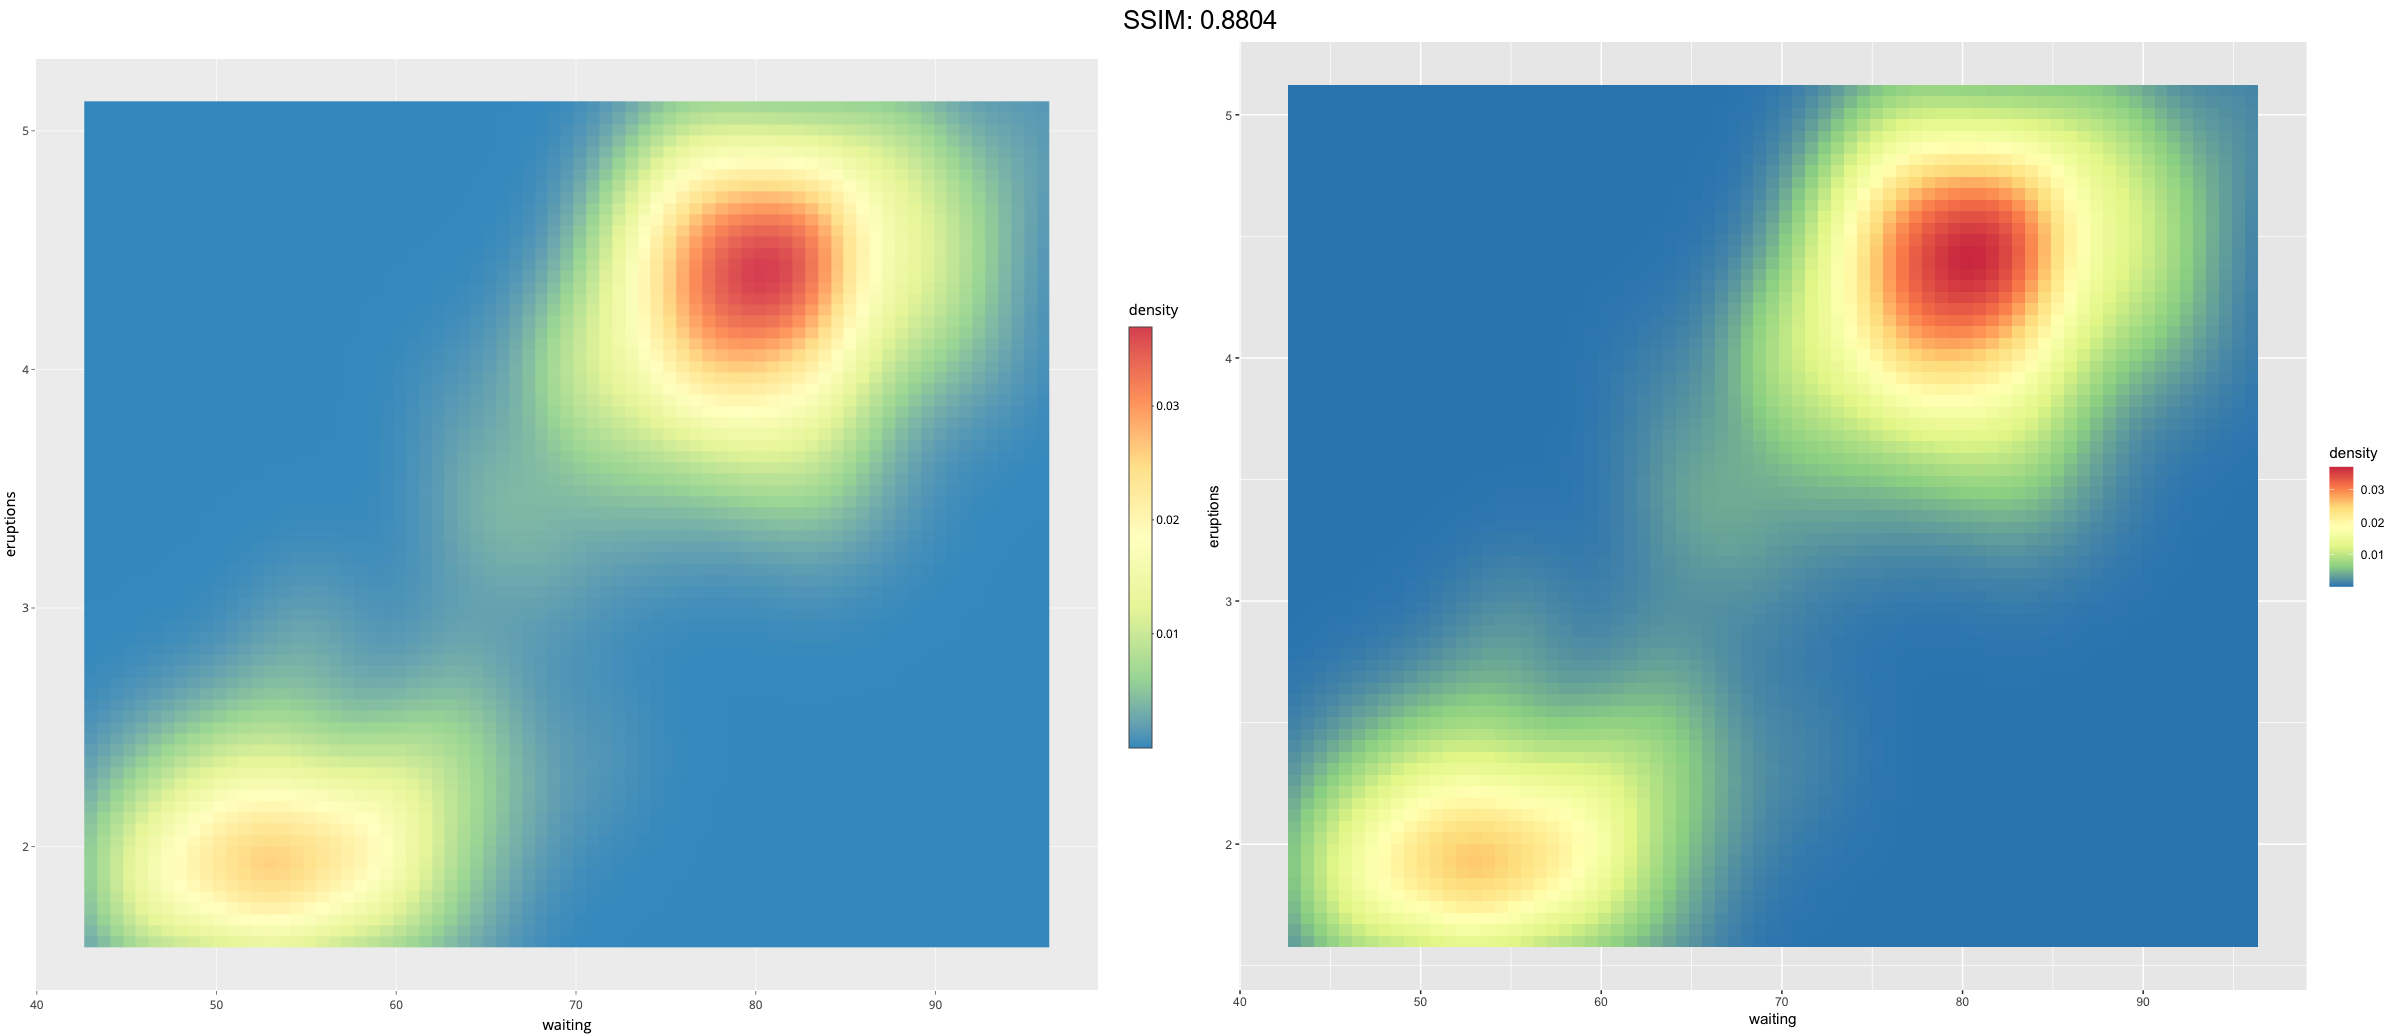
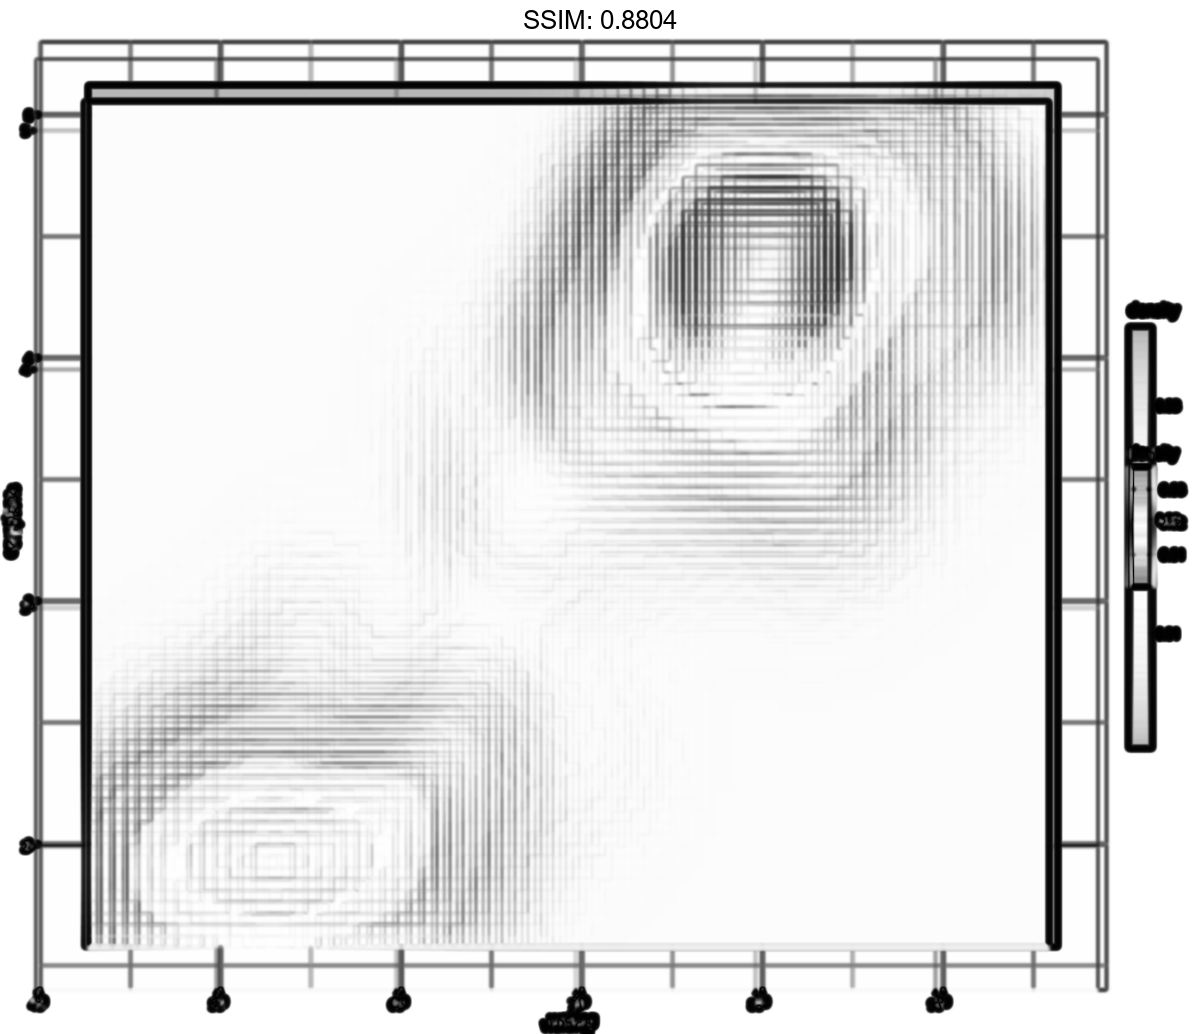
v <- ggplot(faithfuld) +
  geom_tile(aes(waiting, eruptions, fill = density))
p <-  v + scale_fill_distiller(palette = "Spectral")
plotly::ggplotly(p)
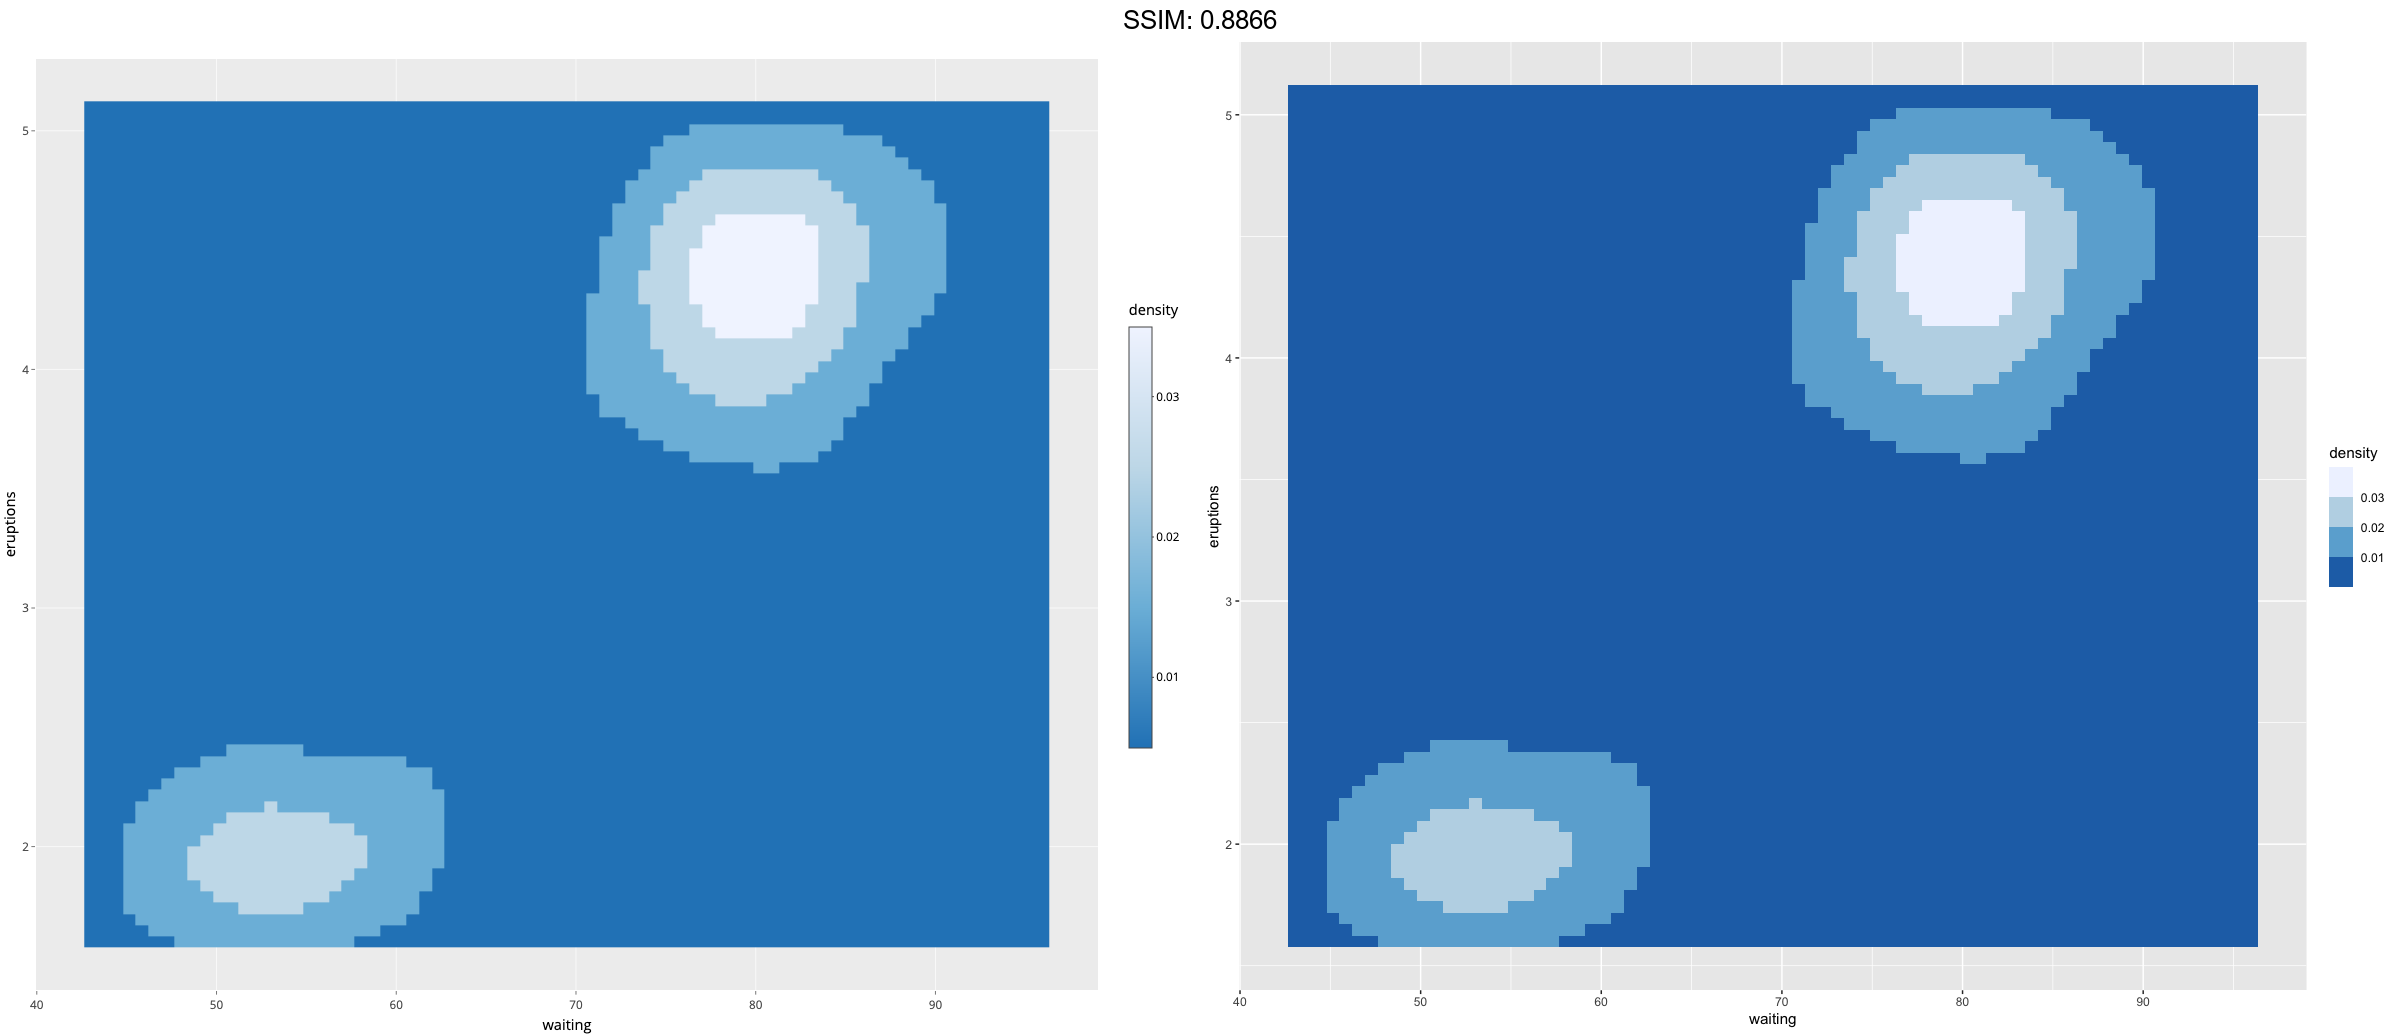
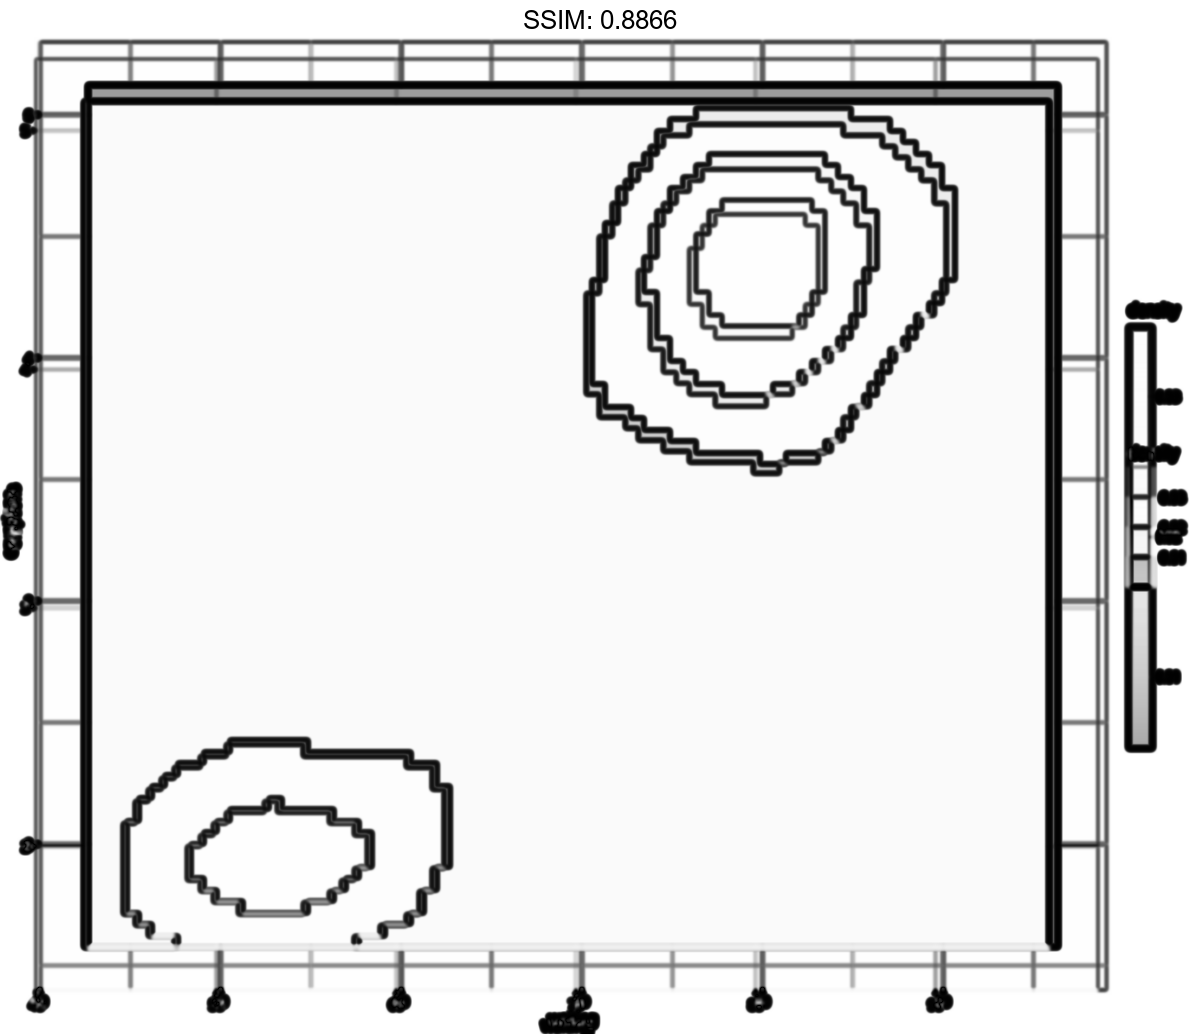
v <- ggplot(faithfuld) +
  geom_tile(aes(waiting, eruptions, fill = density))
p <-  v + scale_fill_fermenter()
plotly::ggplotly(p)