40
50
60
70
80
90
2
3
4
5
0.01
0.02
0.03
density
waiting
eruptions
plotly-logomark
Edit chart
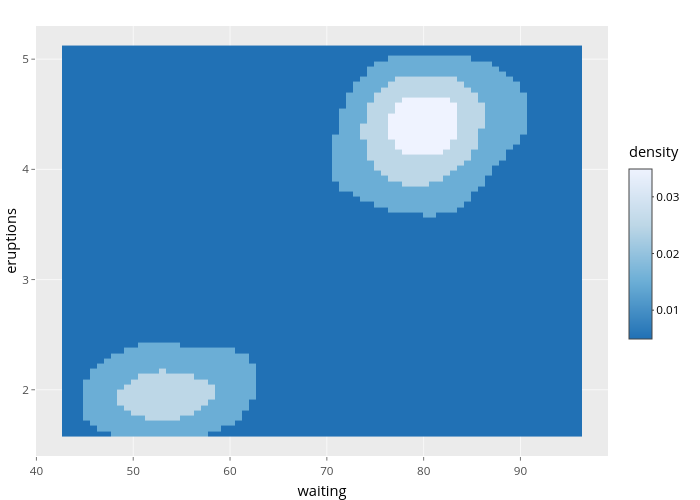
Nadhil's interactive graph and data of "eruptions vs waiting" is a heatmap, showing 99_da7cf47ae2e359c56a2bd935eb91f8c7; with waiting in the x-axis and eruptions in the y-axis.. The x-axis shows values from 39.9560810810811 to 99.0439189189189. The y-axis shows values from 1.39898648648649 to 5.30101351351351.