1
2
0
5000
10000
15000
I1
SI2
SI1
VS2
VS1
VVS2
VVS1
IF
carat
price
Diamond
clarity
plotly-logomark
Edit chart
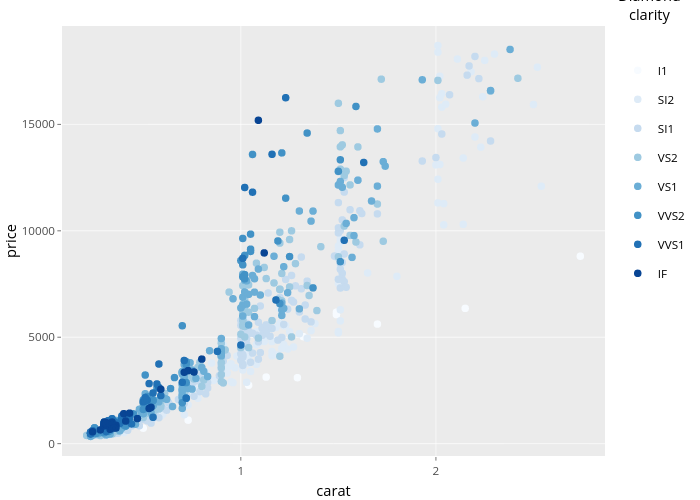
Nadhil's interactive graph and data of "price vs carat" is a scatter chart, showing I1, SI2, SI1, VS2, VS1, VVS2, VVS1, IF; with carat in the x-axis and price in the y-axis.. The x-axis shows values from 0.0835 to 2.8665. The y-axis shows values from -580.35 to 19623.35. This visualization has the following annotation: Diamondclarity