GGPLOT - stat_ellipse
Creates plot from normal data ellipses computation and then convert them with ggplotly.
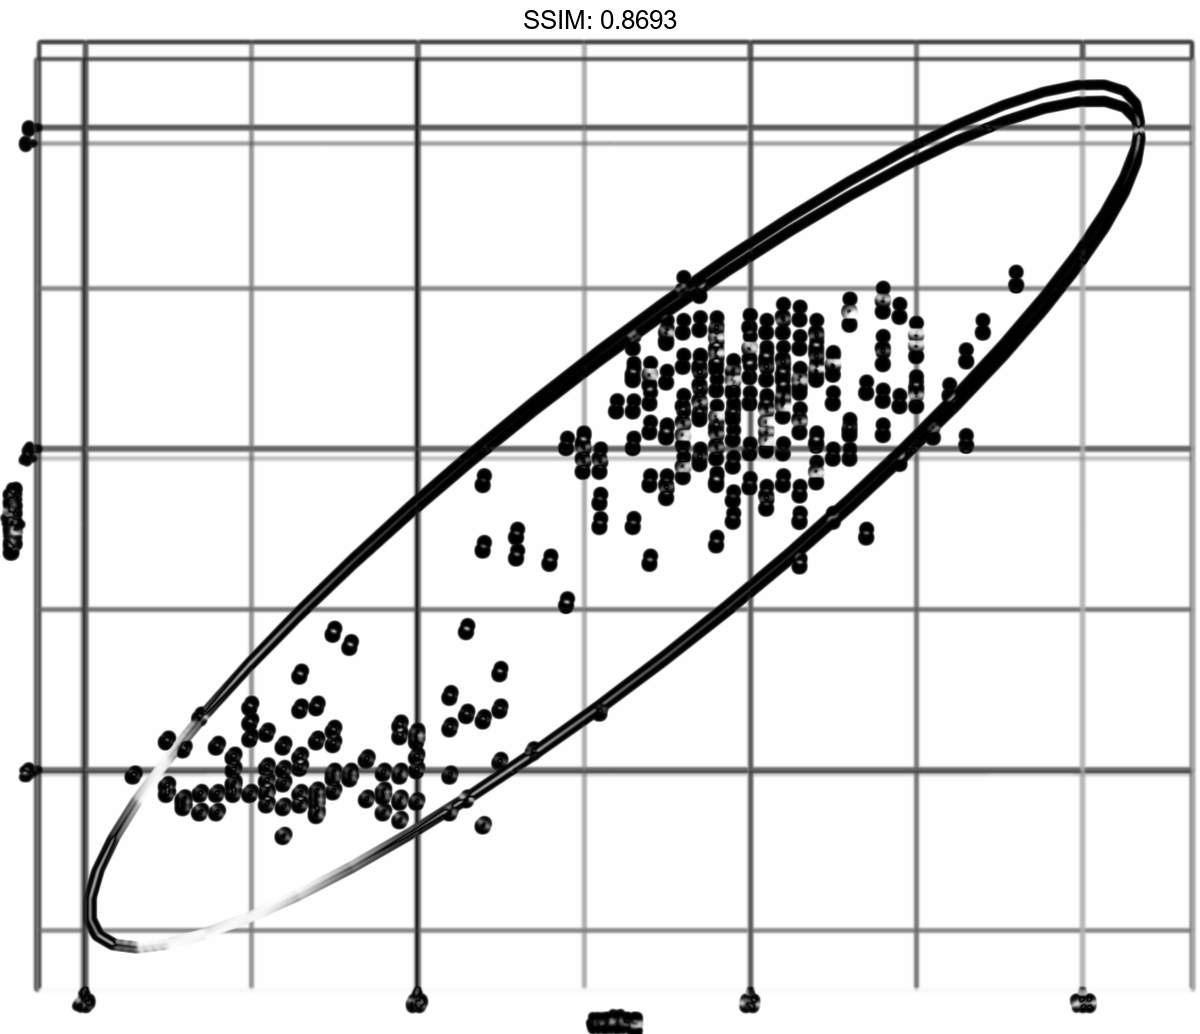
p <-
 ggplot(faithful, aes(waiting, eruptions)) +
  geom_point() +
  stat_ellipse()
plotly::ggplotly(p)


p <-
 ggplot(faithful, aes(waiting, eruptions, color = eruptions > 3)) +
  geom_point() +
  stat_ellipse()
plotly::ggplotly(p)
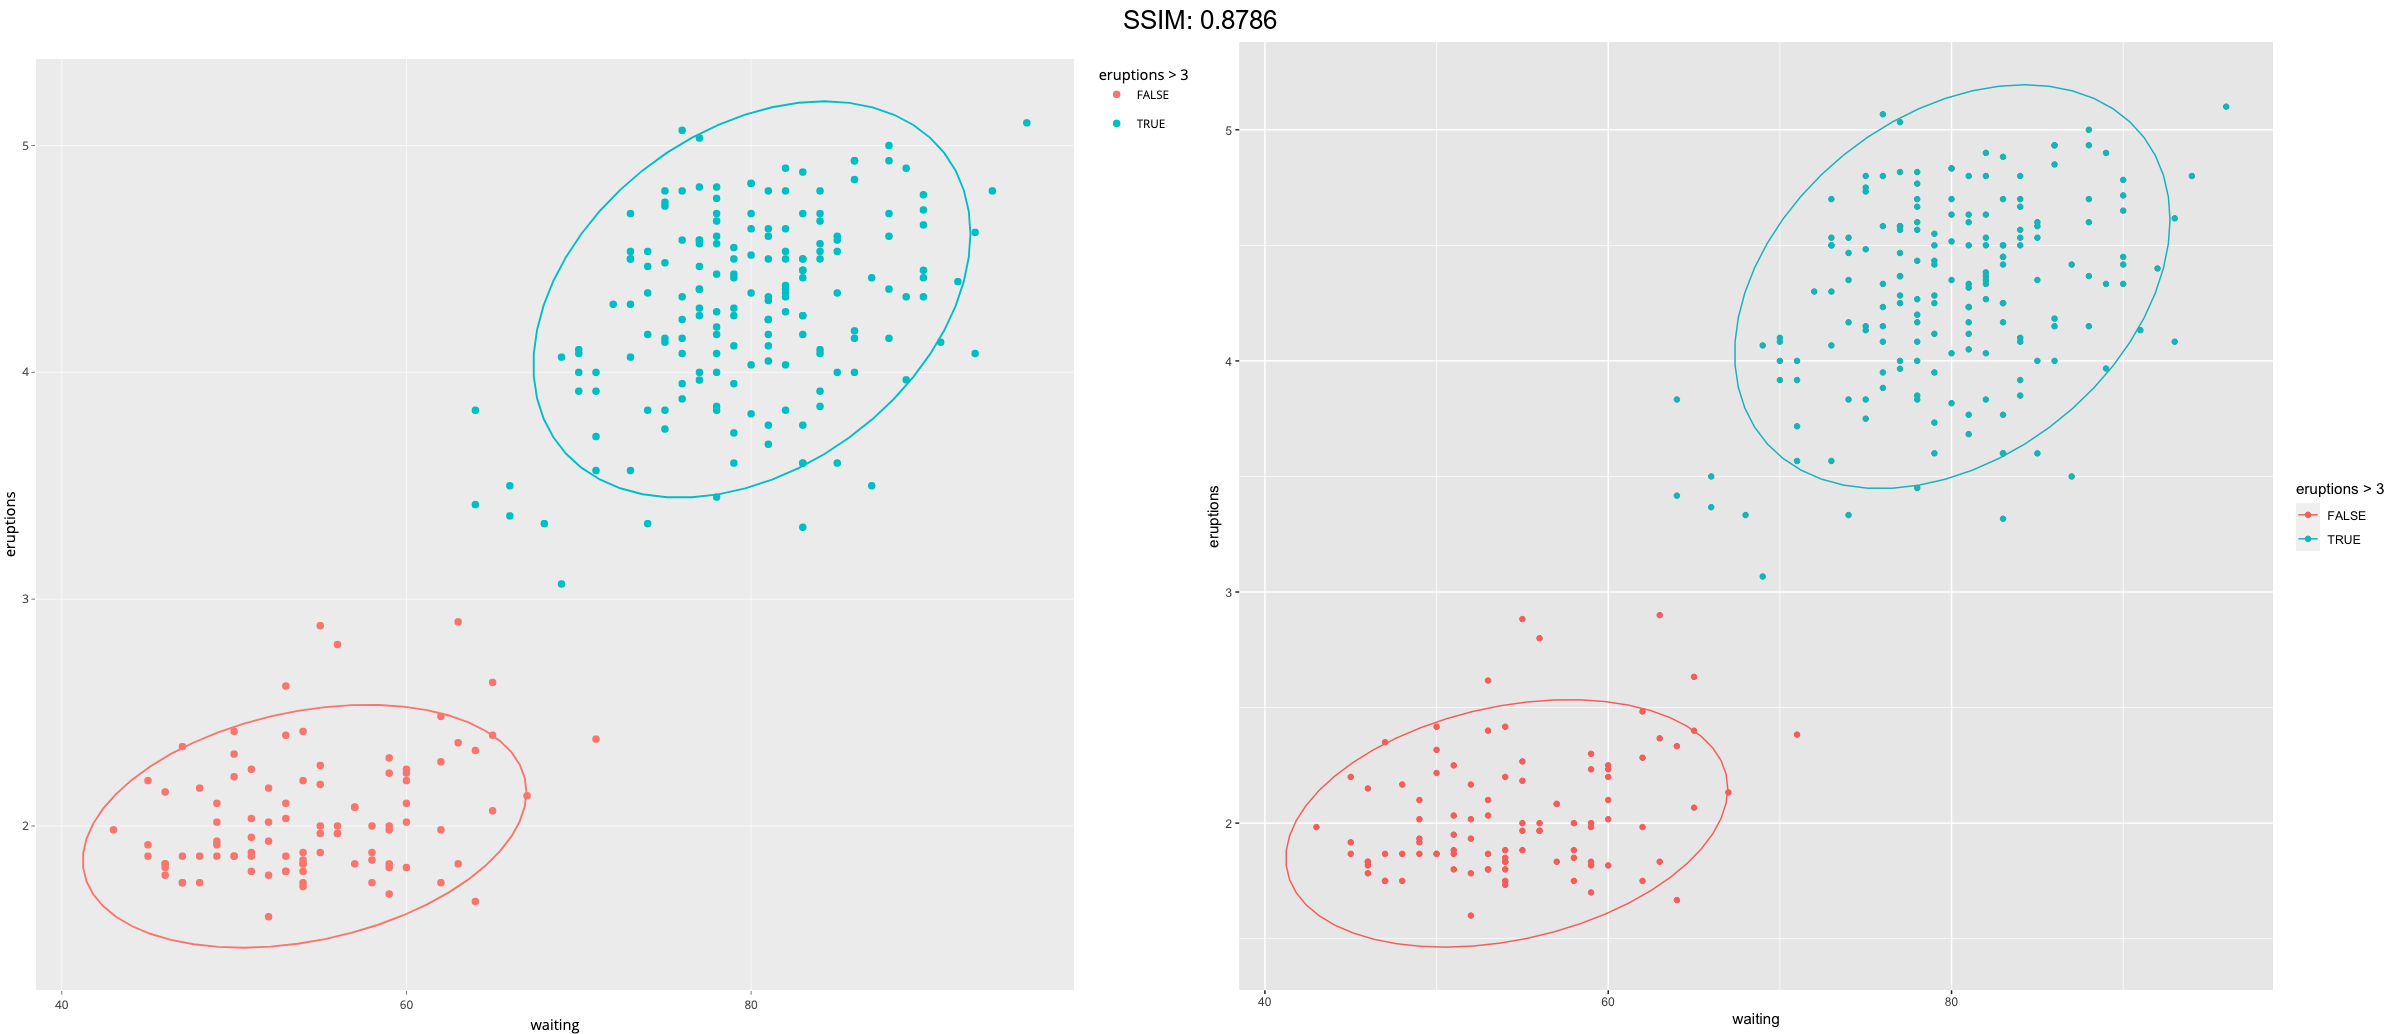
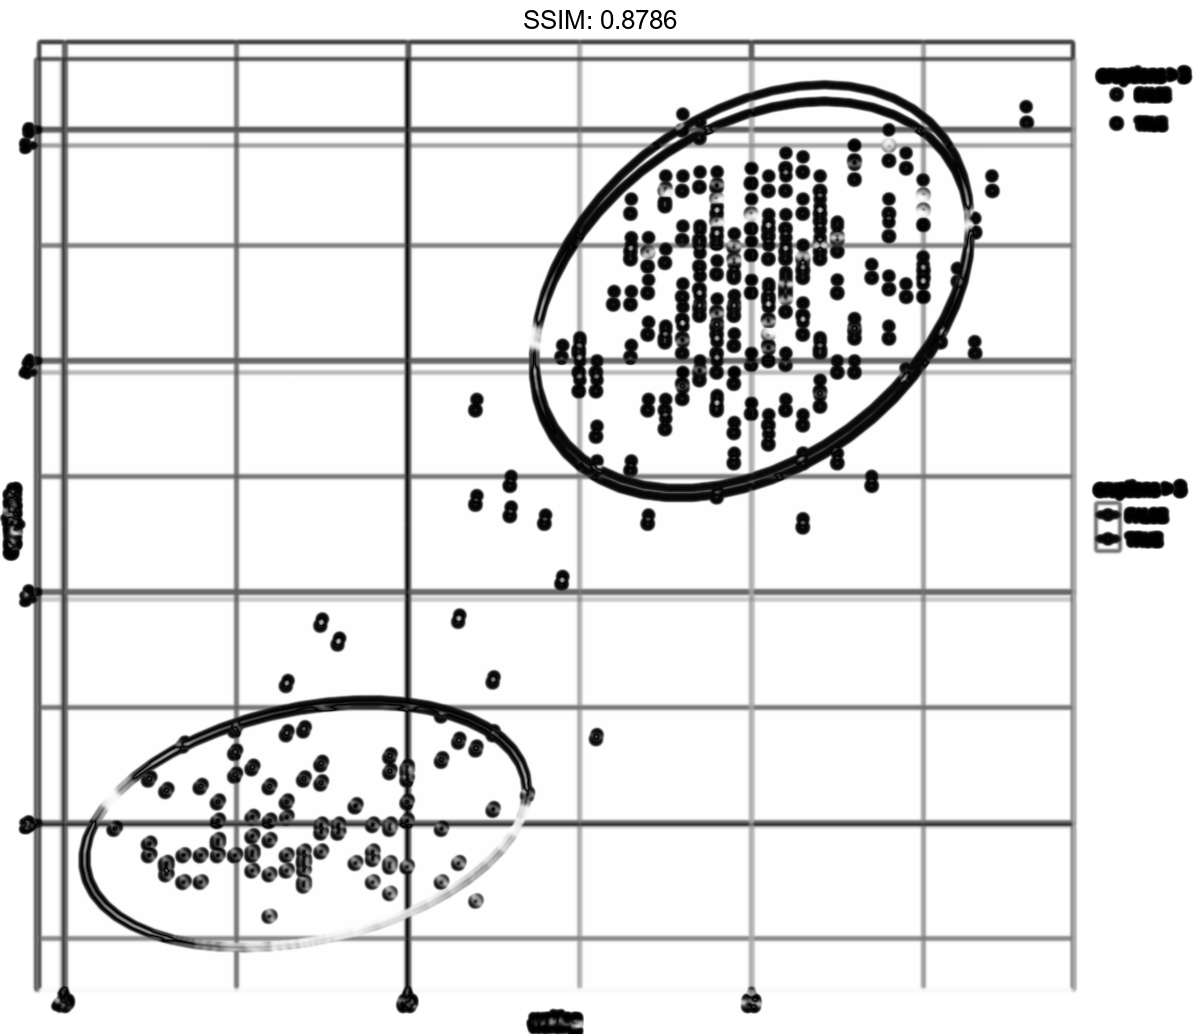
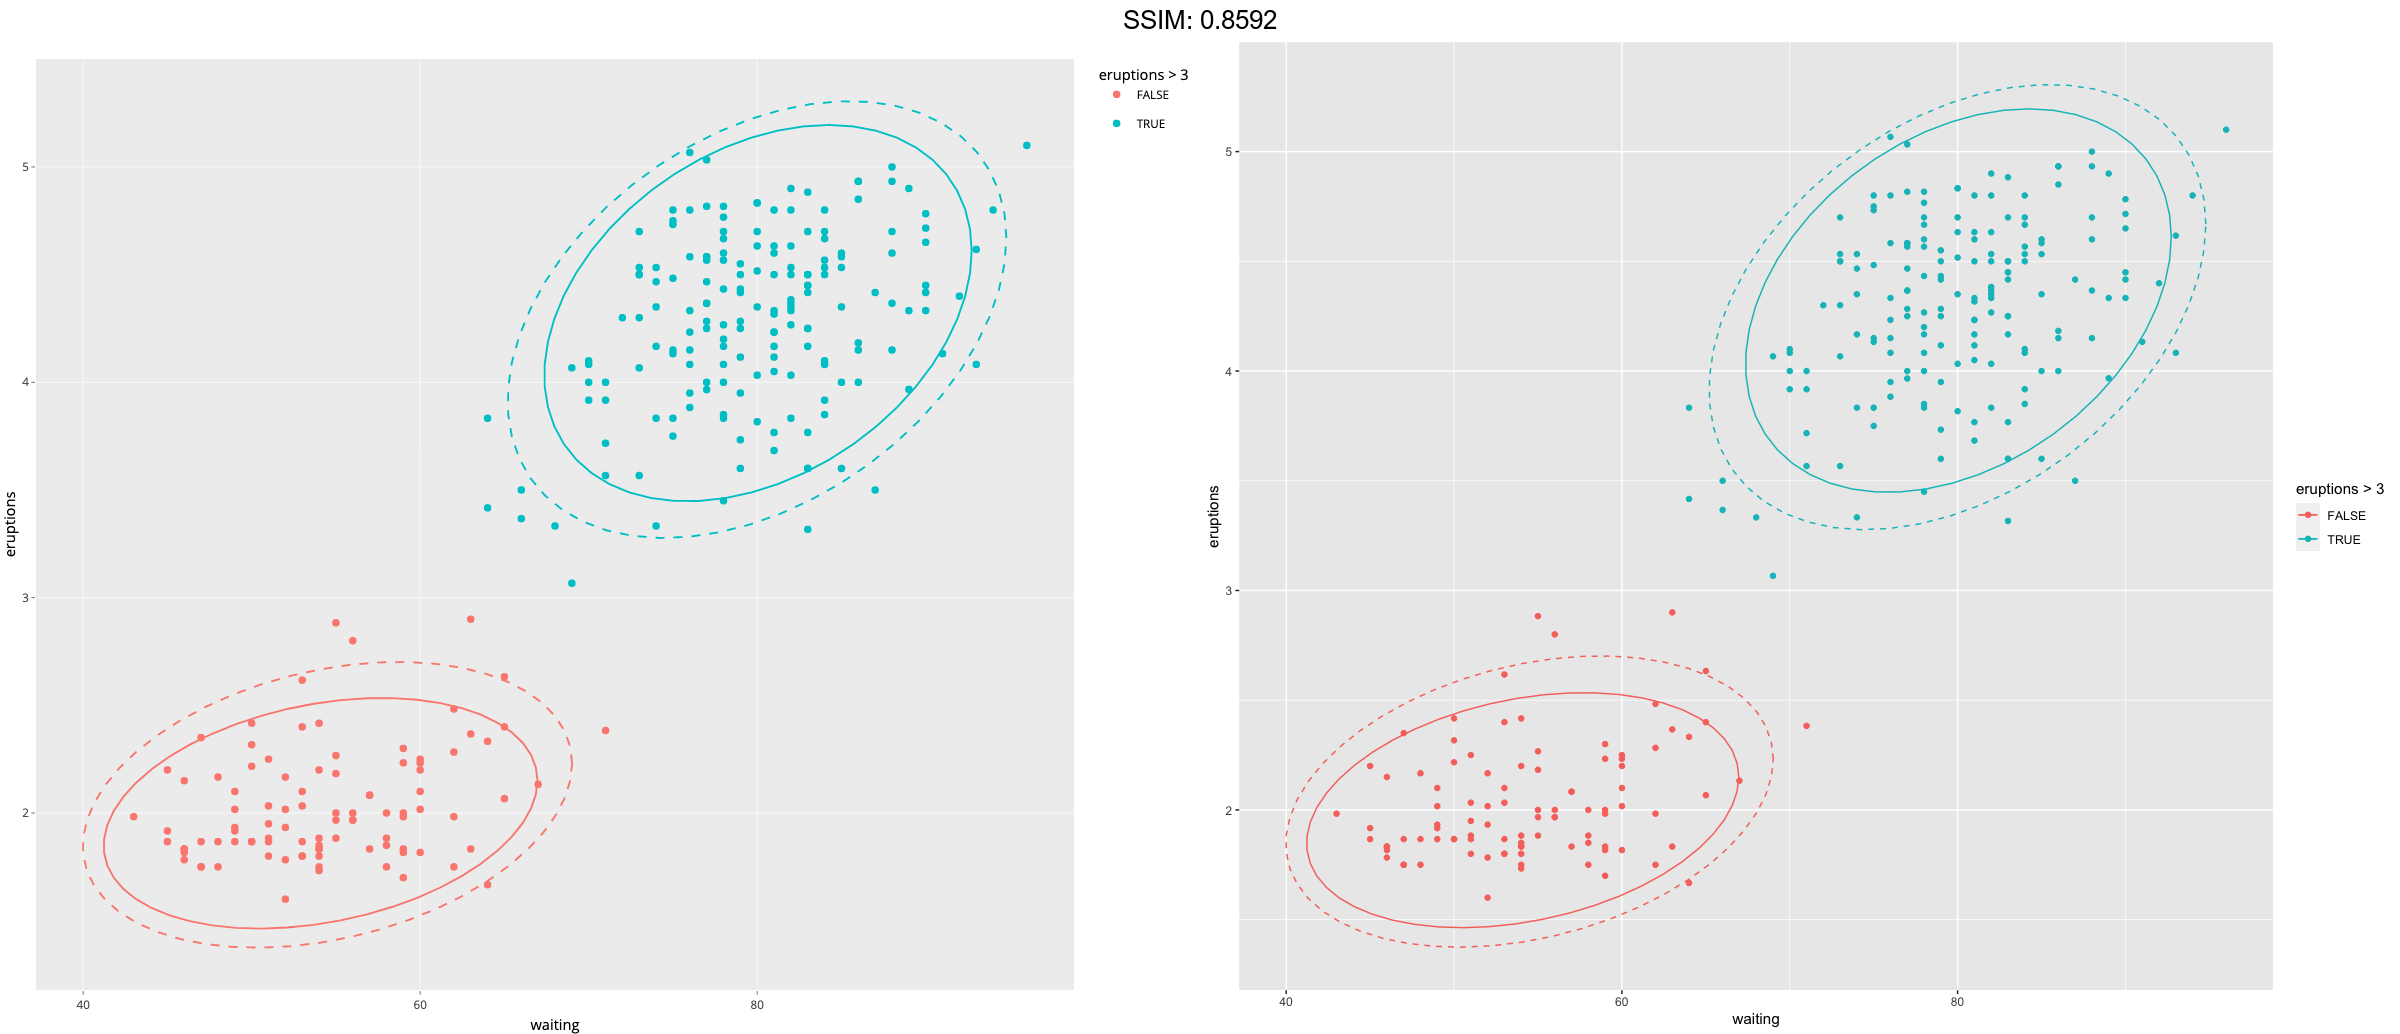
p <-
 ggplot(faithful, aes(waiting, eruptions, color = eruptions > 3)) +
  geom_point() +
  stat_ellipse(type = "norm", linetype = 2) +
  stat_ellipse(type = "t")
plotly::ggplotly(p)
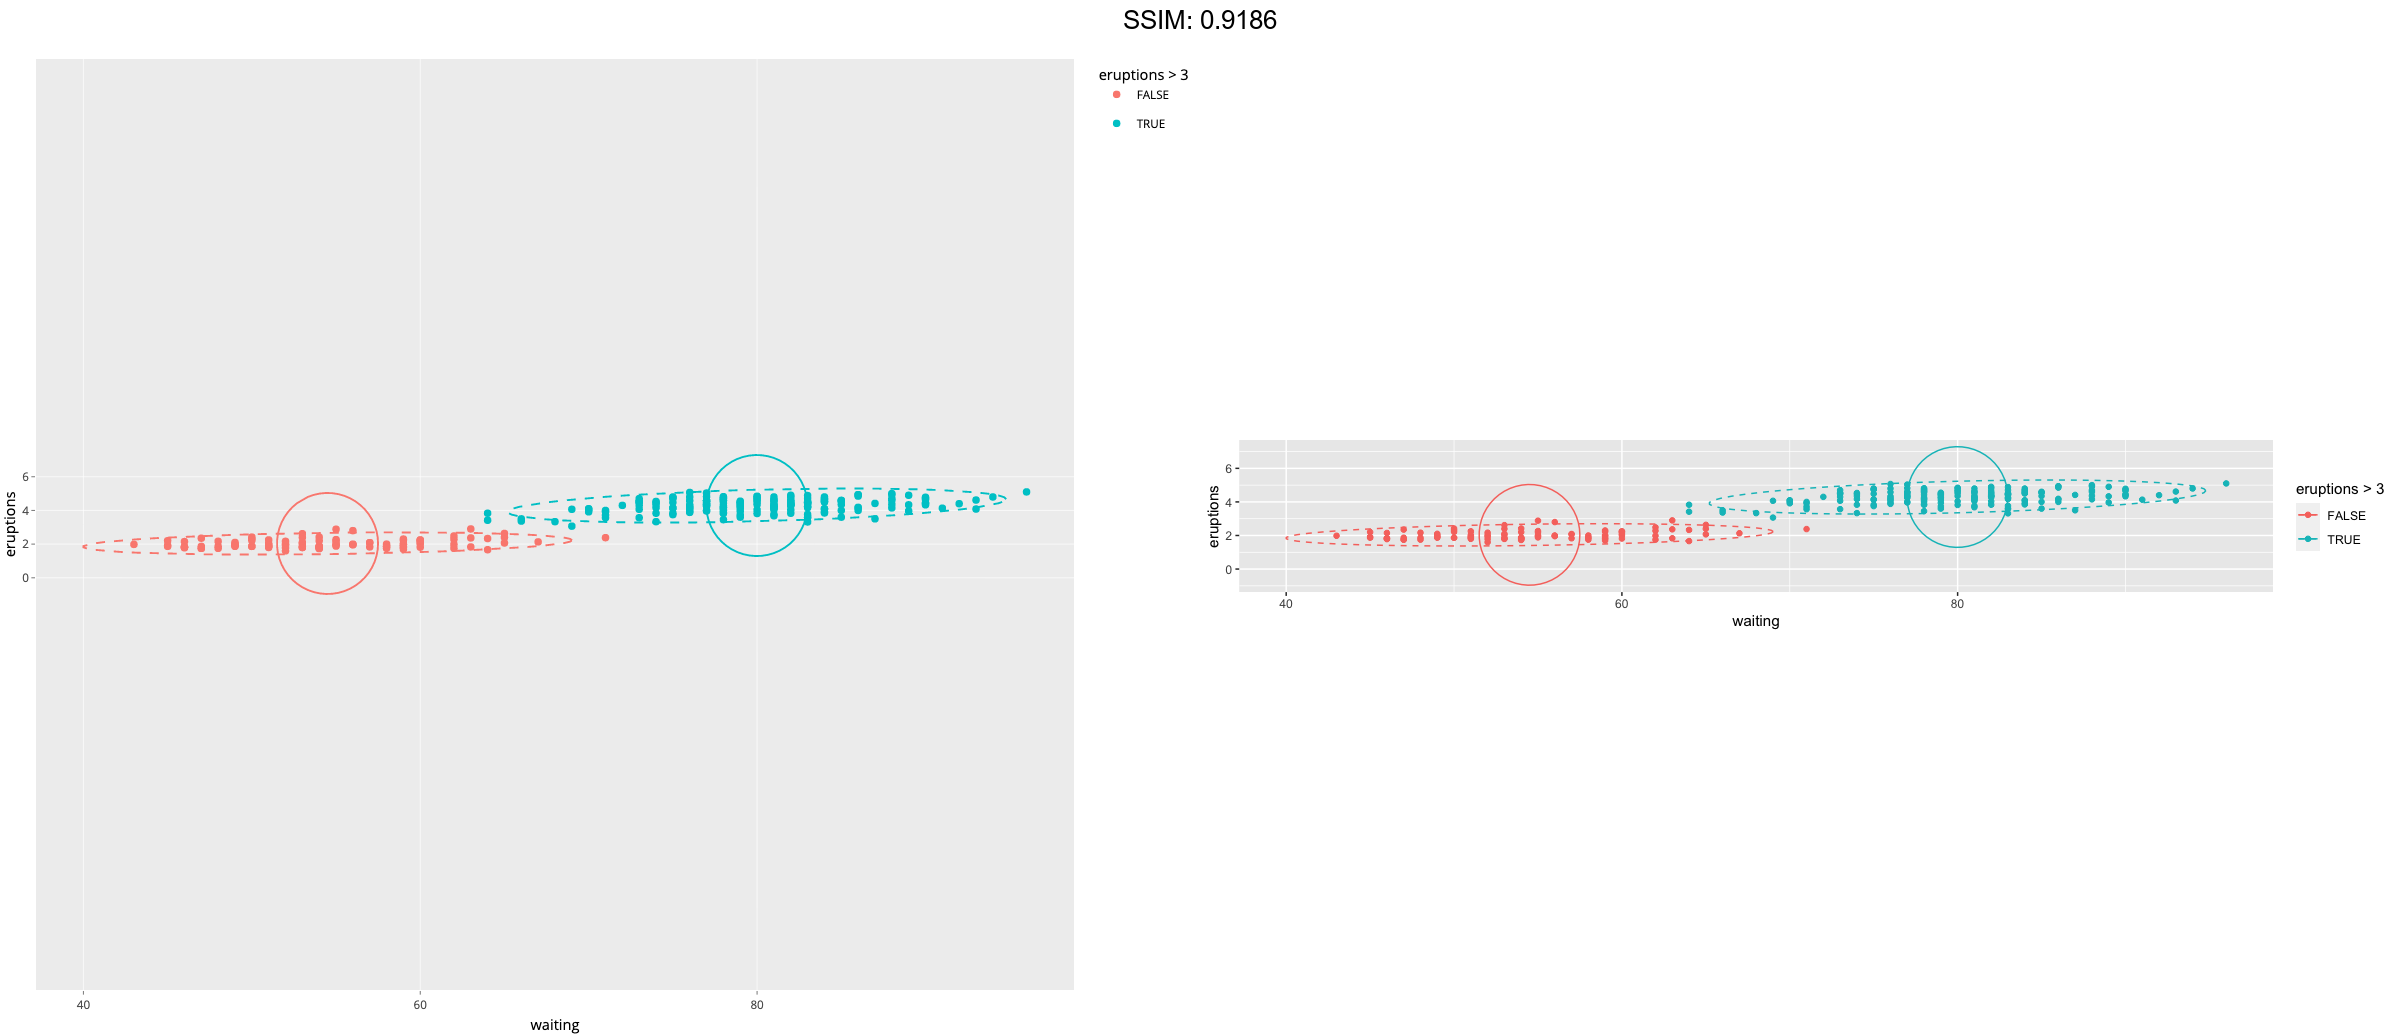
p <-
 ggplot(faithful, aes(waiting, eruptions, color = eruptions > 3)) +
  geom_point() +
  stat_ellipse(type = "norm", linetype = 2) +
  stat_ellipse(type = "euclid", level = 3) +
  coord_fixed()
plotly::ggplotly(p)
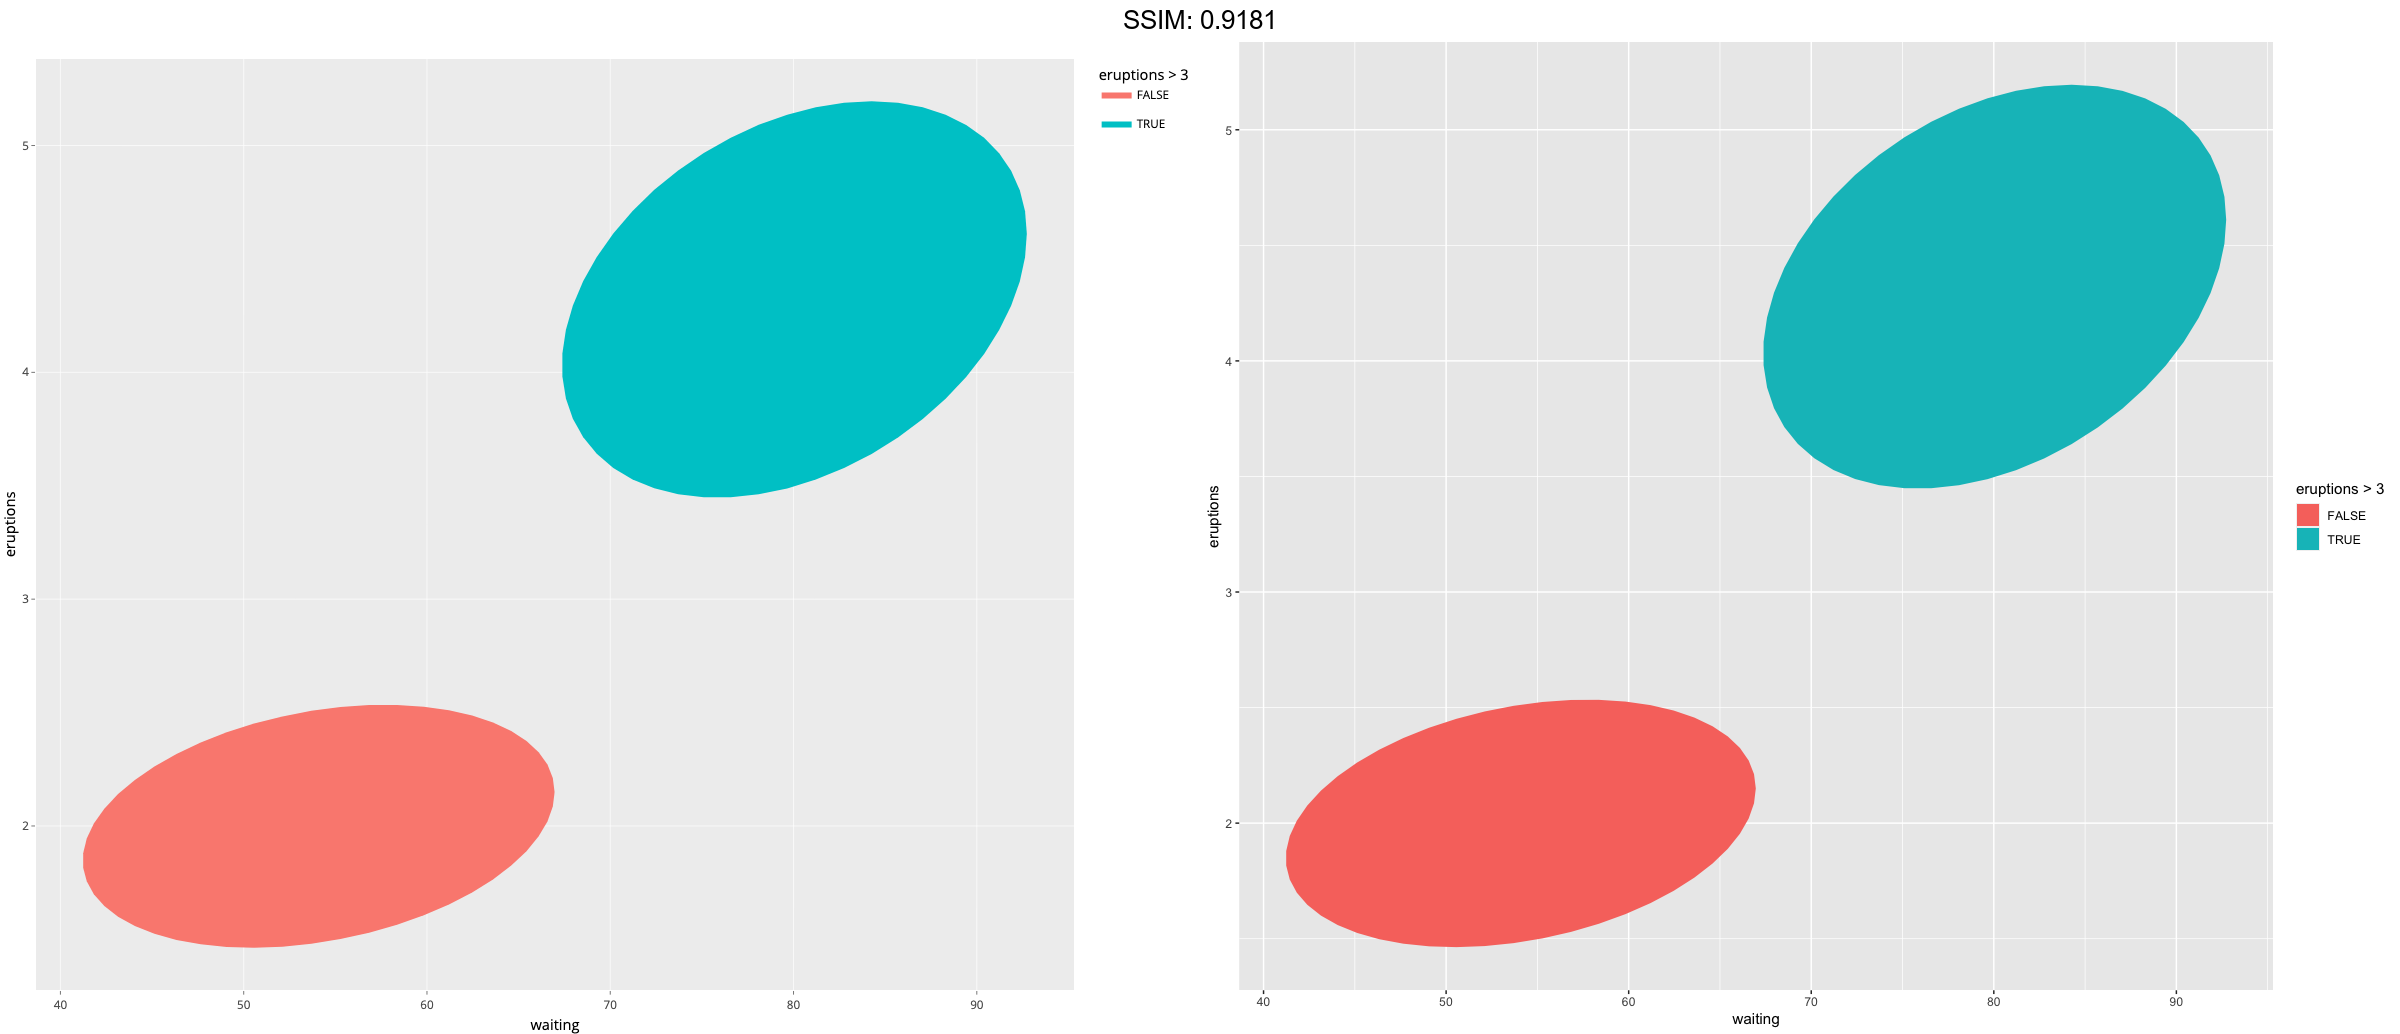
p <-
 ggplot(faithful, aes(waiting, eruptions, fill = eruptions > 3)) +
  stat_ellipse(geom = "polygon")
plotly::ggplotly(p)