Edit chart
Loading graph
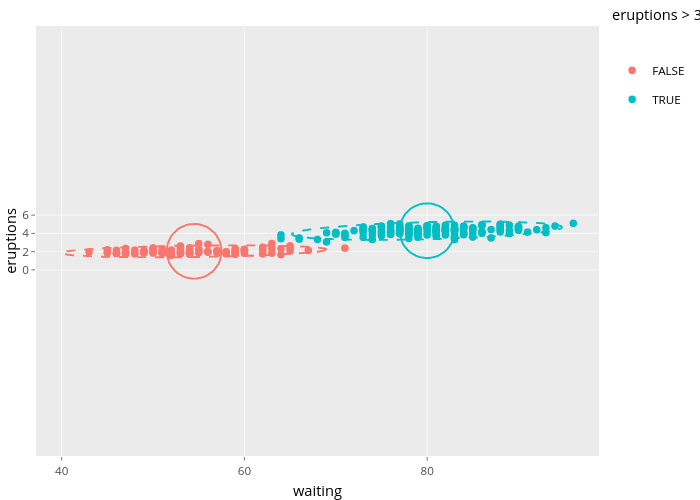
Nadhil's interactive graph and data of "eruptions vs waiting" is a scatter chart, showing FALSE, TRUE, FALSE, TRUE, FALSE, TRUE; with waiting in the x-axis and eruptions in the y-axis.. The x-axis shows values from 37.2014022586339 to 98.7999332257793. The y-axis shows values from -1.37295929626177 to 7.70239617402318. This visualization has the following annotation: eruptions > 3