2
4
6
8
10
12
14
0.18
0.19
0.2
0.21
0.22
0.23
0.24
0.25
0.26
cross_validation_mse
test_mse
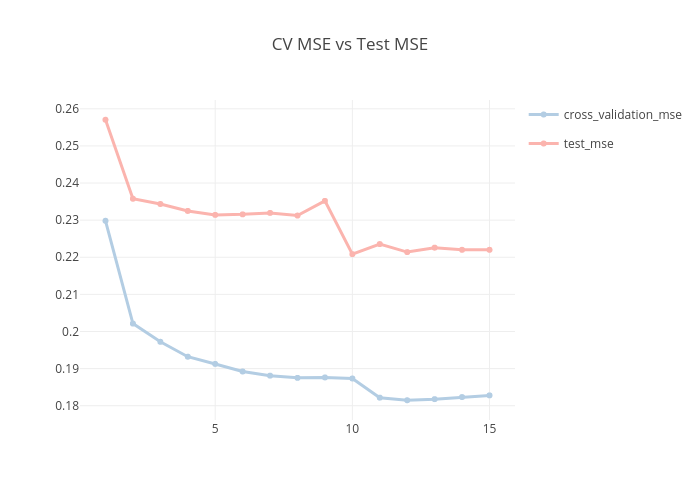
CV MSE vs Test MSE
plotly-logomark
Edit chart
Zx_haowan's interactive graph and data of "CV MSE vs Test MSE" is a scatter chart, showing cross_validation_mse vs test_mse. The x-axis shows values from 0 to 0. The y-axis shows values from 0 to 0.