−140
−135
−130
−125
−120
−115
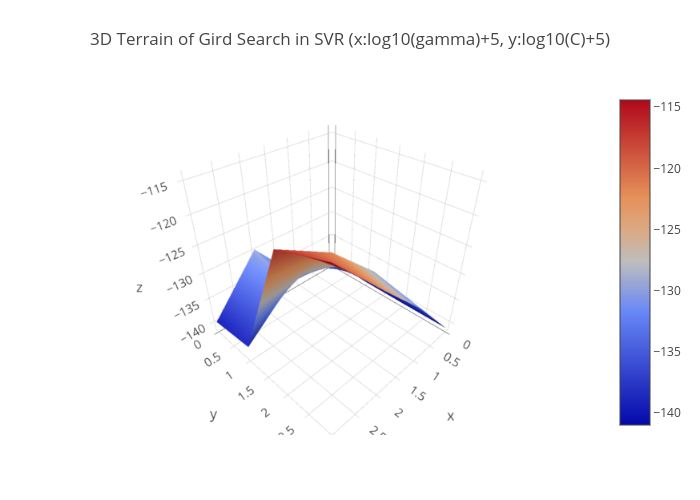
3D Terrain of Gird Search in SVR (x:log10(gamma)+5, y:log10(C)+5)
plotly-logomark
Edit chart
Zx_haowan's interactive graph and data of "3D Terrain of Gird Search in SVR (x:log10(gamma)+5, y:log10(C)+5)" is a surface; with log10(gamma)+5 in the x-axis and log10(C)+5 in the y-axis.. The x-axis shows values from -5 to 5. The y-axis shows values from 0 to 0.