−0.05
−0.04
−0.03
−0.02
−0.01
0
0.01
0.02
0.03
−0.2
−0.1
0
0.1
0.2
0.3
0.4
0.5
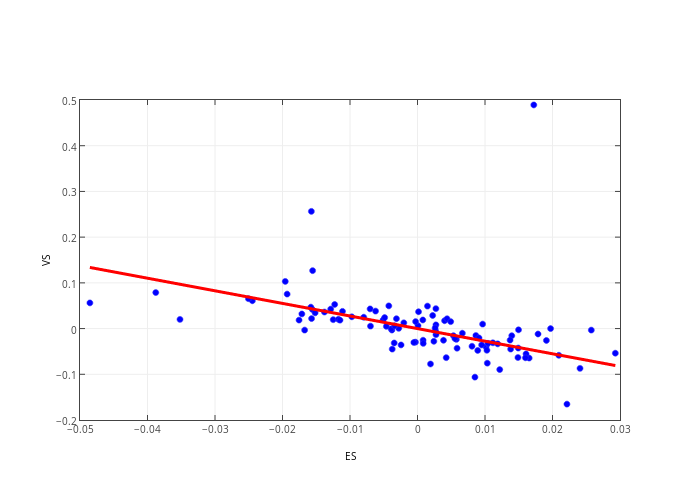
ES
VS
plotly-logomark
Edit chart
Yves's interactive graph and data of "_line0 vs _line1" is a scatter chart, showing _line0 vs _line1. The x-axis shows values from 0 to 0. The y-axis shows values from 0 to 0.