A
B
C
D
E
0
50
100
150
200
250
300
350
400
450
Carbon Footprint per Nutri-Score
Nutri-Score
Carbon Footprint
plotly-logomark
Edit chart
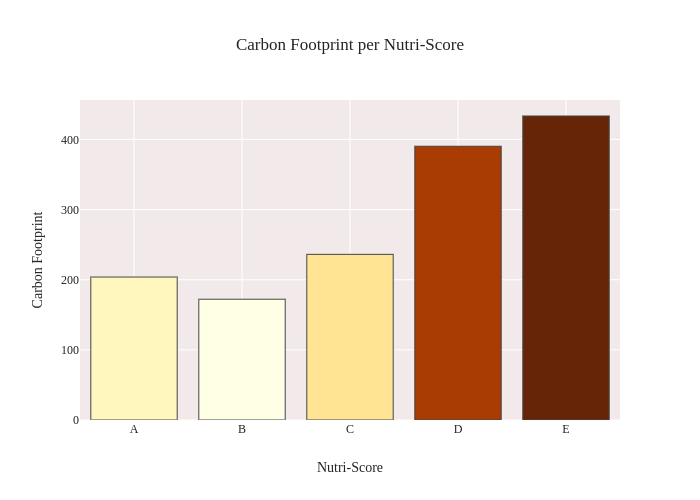
Yohoy's interactive graph and data of "Carbon Footprint per Nutri-Score" is a bar chart; with Nutri-Score in the x-axis and Carbon Footprint in the y-axis.. The x-axis shows values from -0.5 to 4.5. The y-axis shows values from 0 to 456.2526315789474.