A
B
C
D
E
0
50k
100k
150k
200k
Grades Distribution
Grade
Count
plotly-logomark
Edit chart
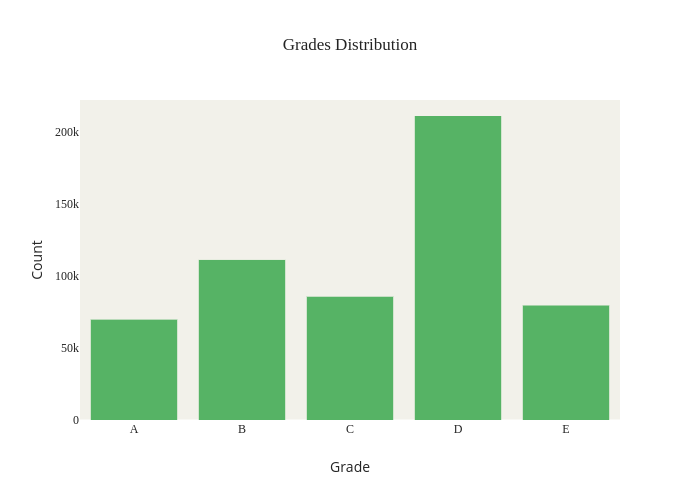
Yohoy's interactive graph and data of "Grades Distribution" is a bar chart; with Grade in the x-axis and Count in the y-axis.. The x-axis shows values from -0.5 to 4.5. The y-axis shows values from 0 to 221740.