a
b
c
d
e
f
g
h
i
j
k
l
m
n
o
p
q
r
s
t
u
v
w
x
y
z
0
50
100
150
200
250
300
Resume Character Frequencies
plotly-logomark
Edit chart
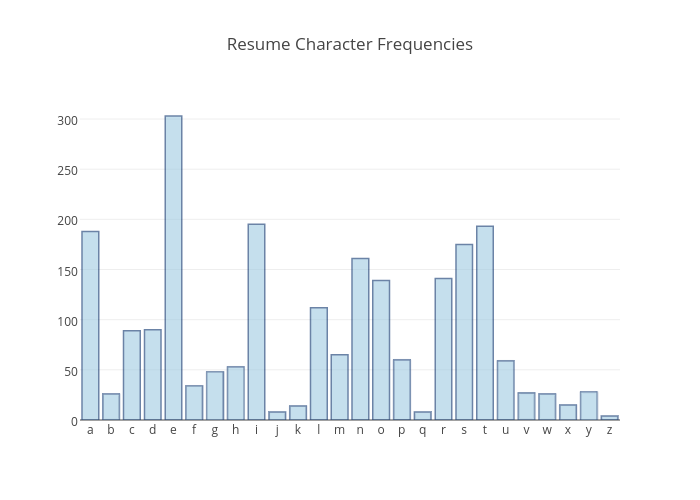
Williams11's interactive graph and data of "Resume Character Frequencies" is a bar chart. The x-axis shows values from 0 to 0. The y-axis shows values from 0 to 0.