1000
2000
3000
4000
5000
−3.5
−3
−2.5
−2
−1.5
−1
−0.5
0
Training set
Cross-Validation set
Baseline model
Training examples
Negative mean absolute error (days)
plotly-logomark
Edit chart
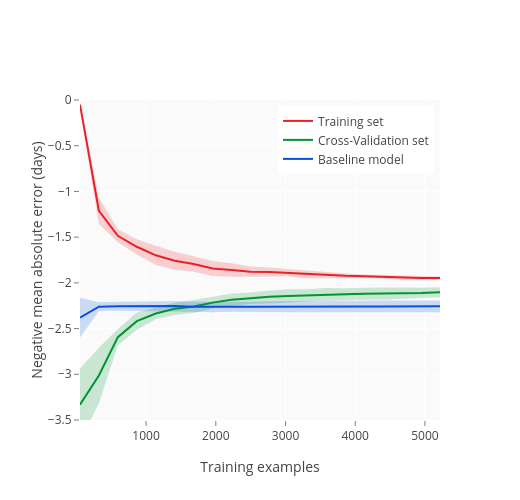
Vturzhitsky's interactive graph and data of "Negative mean absolute error (days) vs Training examples" is a filled scatter chart, showing Training set, Cross-Validation set, Baseline model, Training set, Cross-Validation set, Baseline model; with Training examples in the x-axis and Negative mean absolute error (days) in the y-axis.. The x-axis shows values from 52 to 5216. The y-axis shows values from -3.5 to 0.