Leeftijd
18 - 24 jaar
25 - 39 jaar
40 - 54 jaar
55 - 64 jaar
65 - 75 jaar
0
0.5
1
1.5
2
2.5
Gemiddeld aantal vrijpartijen per week
Leeftijdscategorie
Gemiddeld aantal vrijpartijen per week
plotly-logomark
Edit chart
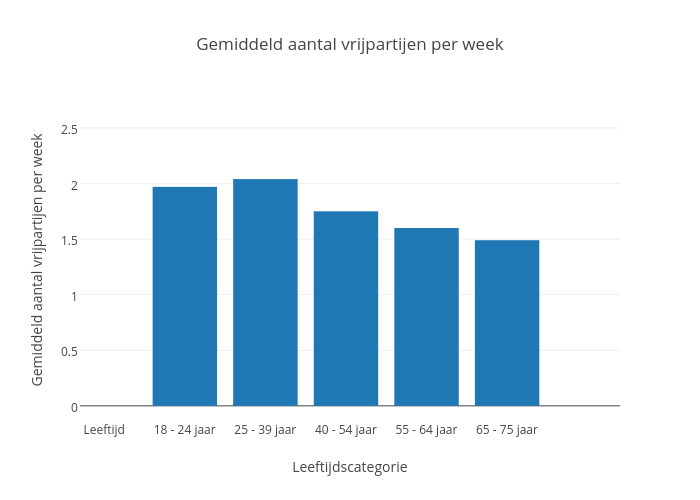
Vtmnieuws's interactive graph and data of "Gemiddeld aantal vrijpartijen per week" is a bar chart, showing Col2; with Leeftijdscategorie in the x-axis and Gemiddeld aantal vrijpartijen per week in the y-axis.. The x-axis shows values from -0.301592434501581 to 6.4016080258548085. The y-axis shows values from -0.12743605618183598 to 2.7514121415291193.