80
100
120
140
160
180
14
16
18
20
22
24
26
28
30
32
United States of America
Germany
France
United Kingdom
Italy
Canada
Spain
Netherlands
Switzerland
Sweden
Norway
Belgium
Austria
Portugal
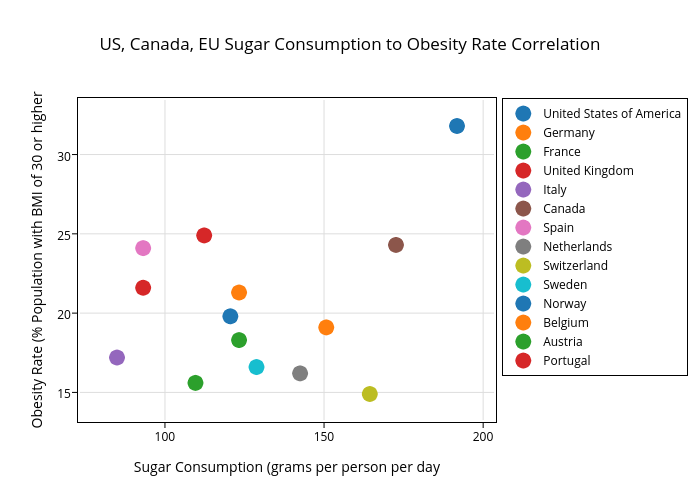
US, Canada, EU Sugar Consumption to Obesity Rate Correlation
Sugar Consumption (grams per person per day
Obesity Rate (% Population with BMI of 30 or higher
plotly-logomark
Edit chart
Vizthinker's interactive graph and data of "US, Canada, EU Sugar Consumption to Obesity Rate Correlation" is a scatter chart, showing United States of America, Germany, France, United Kingdom, Italy, Canada, Spain, Netherlands, Switzerland, Sweden, Norway, Belgium, Austria, Portugal; with Sugar Consumption (grams per person per day in the x-axis and Obesity Rate (% Population with BMI of 30 or higher in the y-axis.. The x-axis shows values from 78.02874603690758 to 198.68125396309244. The y-axis shows values from 13.637021056265102 to 33.0629789437349.