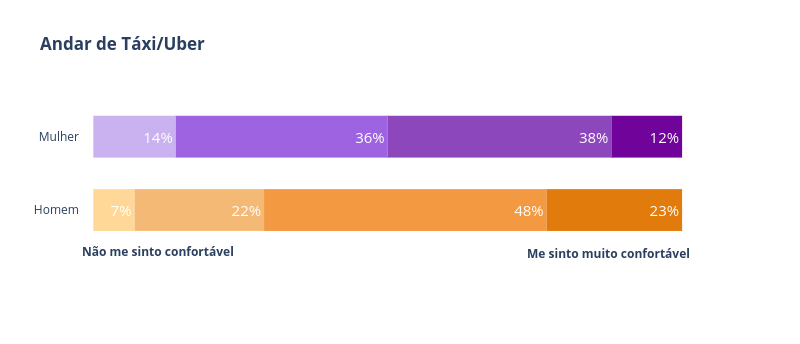
7%
14%
22%
36%
48%
38%
23%
12%
Homem
Mulher
Andar de Táxi/Uber
Não me sinto confortável
Me sinto muito confortável
plotly-logomark
Edit chart
Victorzem's interactive graph and data of "Andar de Táxi/Uber" is a ; with in the y-axis. The x-axis shows values from -2.262416649423635 to 106.4348640341802. The y-axis shows values from -0.7355700325732902 to 1.5. This visualization has the following annotations: Não me sinto confortável; Me sinto muito confortável