1
2
3
4
5
6
7
8
9
10
0
500
1000
1500
2000
2500
Gender
Female
Male
Average rating per actor
Average rating
Number of actors
plotly-logomark
Edit chart
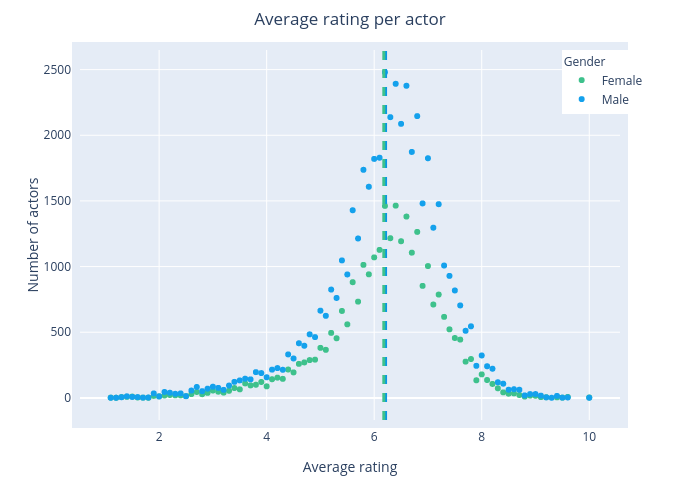
Tuturta's interactive graph and data of "Average rating per actor" is a scatter chart, showing Female vs Male; with Average rating in the x-axis and Number of actors in the y-axis.. The x-axis shows values from 0.5547286184210526 to 10.545271381578948. The y-axis shows values from -165.65546218487395 to 2646.655462184874.