0
5
10
15
20
25
30
0
0.02
0.04
0.06
0.08
0.1
0.12
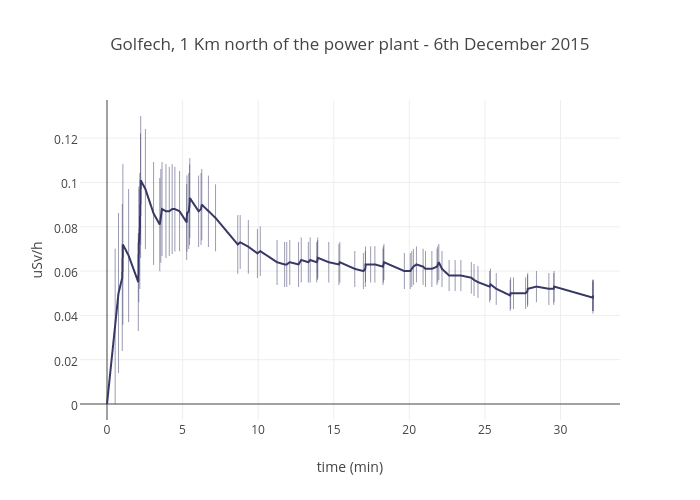
Golfech, 1 Km north of the power plant - 6th December 2015
time (min)
uSv/h
plotly-logomark
Edit chart
Tournadey's interactive graph and data of "Golfech, 1 Km north of the power plant - 6th December 2015" is a scatter chart, showing uSv/h; with time (min) in the x-axis and uSv/h in the y-axis.. The x-axis shows values from -1.786111111111111 to 33.93611111111111. The y-axis shows values from -0.0072222222222222245 to 0.13722222222222222.