0
50
100
150
200
0
0.02
0.04
0.06
0.08
0.1
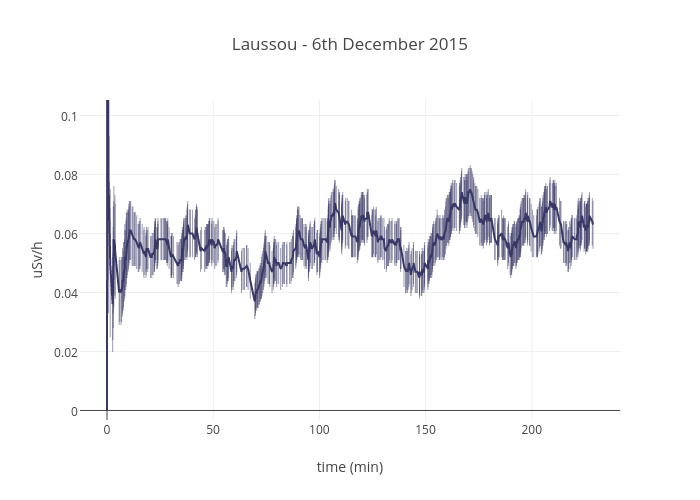
Laussou - 6th December 2015
time (min)
uSv/h
plotly-logomark
Edit chart
Tournadey's interactive graph and data of "Laussou - 6th December 2015" is a scatter chart, showing uSv/h; with time (min) in the x-axis and uSv/h in the y-axis.. The x-axis shows values from -12.708888888888888 to 241.46888888888887. The y-axis shows values from -0.0032307692307692315 to 0.10523076923076924.