Mon
Tue
Wed
Thu
Fri
Sat
Sun
Mon
Tue
Wed
Thu
0
50
100
150
200
250
300
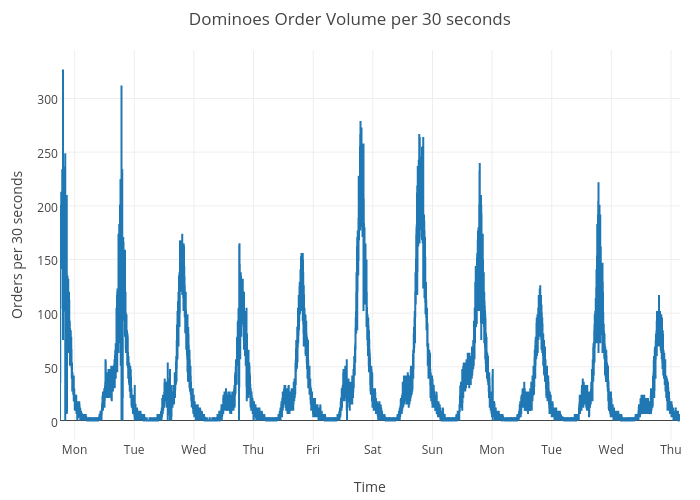
Dominoes Order Volume per 30 seconds
Time
Orders per 30 seconds
plotly-logomark
Edit chart
Tomd324's interactive graph and data of "Dominoes Order Volume per 30 seconds" is a line chart, showing Col2; with Time in the x-axis and Orders per 30 seconds in the y-axis.. The x-axis shows values from 1432487130000 to 1433385480000. The y-axis shows values from -18.166666666666668 to 345.1666666666667.