Jun 29
2014
Jul 13
Jul 27
Aug 10
Aug 24
Sep 7
Sep 21
0
0.5
1
1.5
2
2.5
Bullish
Bearish
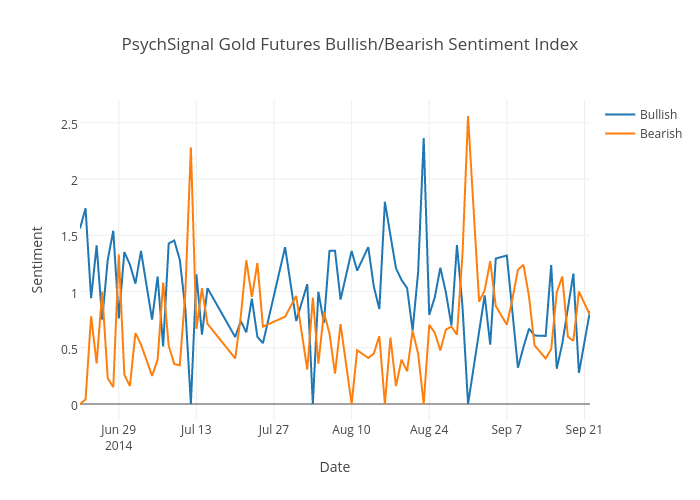
PsychSignal Gold Futures Bullish/Bearish Sentiment Index
Date
Sentiment
plotly-logomark
Edit chart
Tkinder's interactive graph and data of "PsychSignal Gold Futures Bullish/Bearish Sentiment Index" is a scatter chart, showing Bullish vs Bearish; with Date in the x-axis and Sentiment in the y-axis.. The x-axis shows values from 1403413200000 to 1411362000000. The y-axis shows values from -0.14222222222222225 to 2.7022222222222223.