1998
2000
2002
2004
2006
2008
2010
2012
2014
−4
−2
0
2
4
Portugal
Média Zona do Euro
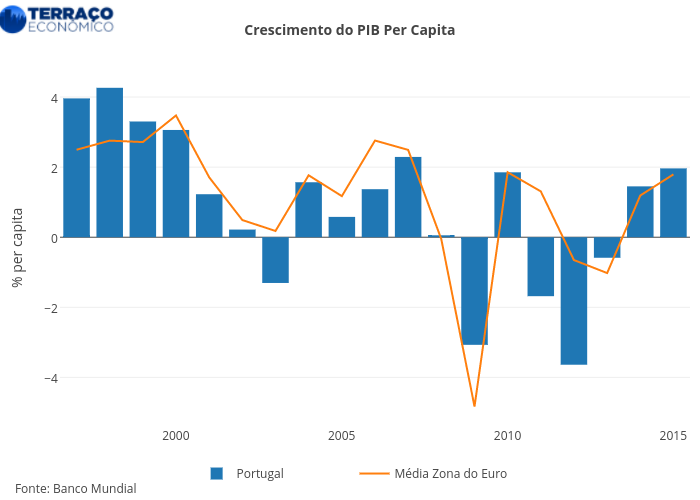
Crescimento do PIB Per Capita
% per capita
Fonte:
Banco Mundial
plotly-logomark
Edit chart
Terracoeconomico's interactive graph and data of "Crescimento do PIB Per Capita" is a bar chart, showing Portugal vs Média Zona do Euro; with in the x-axis and % per capita in the y-axis.. The x-axis shows values from 1996-07-02 12:00 to 2015-07-02 12:00. The y-axis shows values from -5.387292029324983 to 4.771436892069736. This visualization has the following annotation: Fonte: Banco Mundial