0
0.2
0.4
0.6
0.8
1
0
0.2
0.4
0.6
0.8
1
0
0.5
1
1.5
2
2.5
3
color
B_18
B_17
plotly-logomark
Edit chart
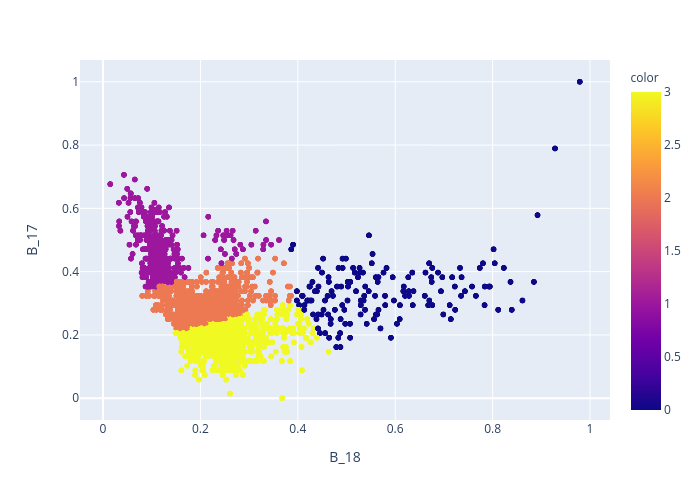
Shva3756's interactive graph and data of "B_17 vs B_18" is a scattergl; with B_18 in the x-axis and B_17 in the y-axis.. The x-axis shows values from 0 to 0. The y-axis shows values from 0 to 0.