B_2
B_18
B_19
B_15
B_17
B_25
B_24
B_16
B_16
B_24
B_25
B_17
B_15
B_19
B_18
B_2
−0.8
−0.6
−0.4
−0.2
0
0.2
0.4
0.6
0.8
1
Correlation heatmap
1.0
-0.0
0.01
0.01
0.0
-0.02
-0.01
-0.0
-0.0
1.0
0.19
0.16
-0.15
-0.19
-0.19
-0.1
0.01
0.19
1.0
0.78
0.7
-0.71
-0.71
-0.77
0.01
0.16
0.78
1.0
0.78
-0.77
-0.77
-0.85
0.0
-0.15
0.7
0.78
1.0
-0.69
-0.69
-0.79
-0.02
-0.19
-0.71
-0.77
-0.69
1.0
0.69
0.76
-0.01
-0.19
-0.71
-0.77
-0.69
0.69
1.0
0.75
-0.0
-0.1
-0.77
-0.85
-0.79
0.76
0.75
1.0
plotly-logomark
Edit chart
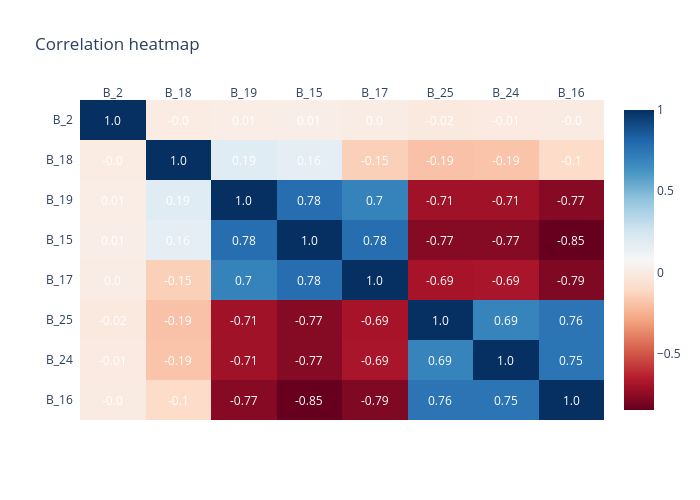
Shva3756's interactive graph and data of "Correlation heatmap" is a heatmap. The x-axis shows values from 0 to 0. The y-axis shows values from 0 to 0. This visualization has the following annotations: 1.0; -0.0; 0.01; 0.01; 0.0; -0.02; -0.01; -0.0; -0.0; 1.0; 0.19; 0.16; -0.15; -0.19; -0.19; -0.1; 0.01; 0.19; 1.0; 0.78; 0.7; -0.71; -0.71; -0.77; 0.01; 0.16; 0.78; 1.0; 0.78; -0.77; -0.77; -0.85; 0.0; -0.15; 0.7; 0.78; 1.0; -0.69; -0.69; -0.79; -0.02; -0.19; -0.71; -0.77; -0.69; 1.0; 0.69; 0.76; -0.01; -0.19; -0.71; -0.77; -0.69; 0.69; 1.0; 0.75; -0.0; -0.1; -0.77; -0.85; -0.79; 0.76; 0.75; 1.0