0
100
200
300
400
500
600
0
2
4
6
8
10
12
14
16
Length of Metro System in Kms
Million Rides Per Kilometer Per Year
Beijing
Chongqing
Delhi
Guangzhou
Kolkata
London
Madrid
Moscow
Nanjing
New York City
Seoul
Shanghai
Shenzhen
Tokyo
Mumbai (Suburban Rail)
plotly-logomark
Edit chart
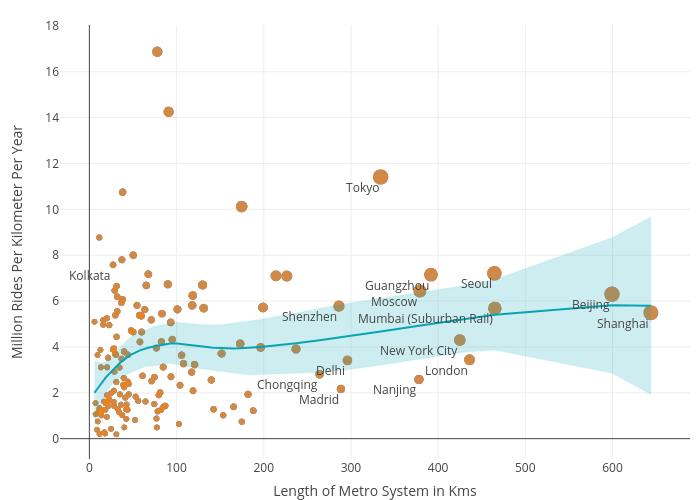
Shubho.roy85's interactive graph and data of "Million Rides Per Kilometer Per Year vs Length of Metro System in Kms" is a scatter chart, showing Loess Smoother vs Standard Error; with Length of Metro System in Kms in the x-axis and Million Rides Per Kilometer Per Year in the y-axis.. The x-axis shows values from 0 to 0. The y-axis shows values from 0 to 0. This visualization has the following annotations: Beijing; Chongqing; Delhi; Guangzhou; Kolkata; London; Madrid; Moscow; Nanjing; New York City; Seoul; Shanghai; Shenzhen; Tokyo; Mumbai (Suburban Rail)