Tue, Sep 01
Fri, Sep 04
Mon, Sep 07
Thu, Sep 10
Sun, Sep 13
Wed, Sep 16
Sat, Sep 19
Tue, Sep 22
60k
70k
80k
90k
100k
110k
120k
Entries
Exits
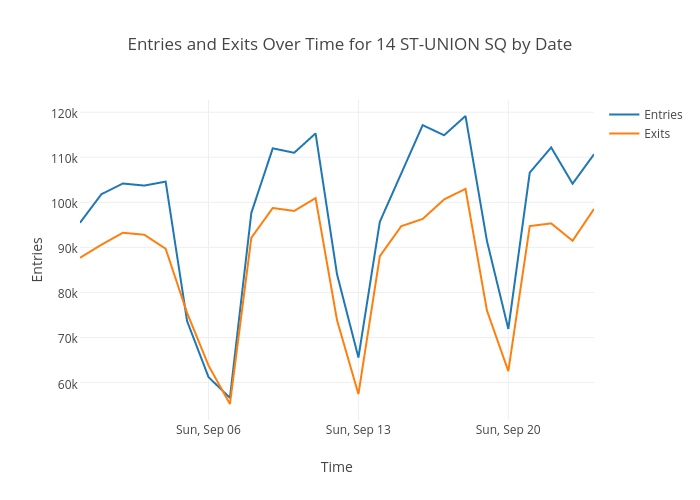
Entries and Exits Over Time for 14 ST-UNION SQ by Date
Time
Entries
plotly-logomark
Edit chart
Sherminn's interactive graph and data of "Entries and Exits Over Time for 14 ST-UNION SQ by Date" is a scatter chart, showing Entries vs Exits; with Time in the x-axis and Entries in the y-axis.. The x-axis shows values from 0 to 0. The y-axis shows values from 0 to 0.