Mon, 12:00AM, Sep 07
Tue, 12:00AM, Sep 08
Wed, 12:00AM, Sep 09
Thu, 12:00AM, Sep 10
Fri, 12:00AM, Sep 11
Sat, 12:00AM, Sep 12
Sun, 12:00AM, Sep 13
0
5k
10k
15k
20k
25k
30k
35k
40k
Entries
Exits
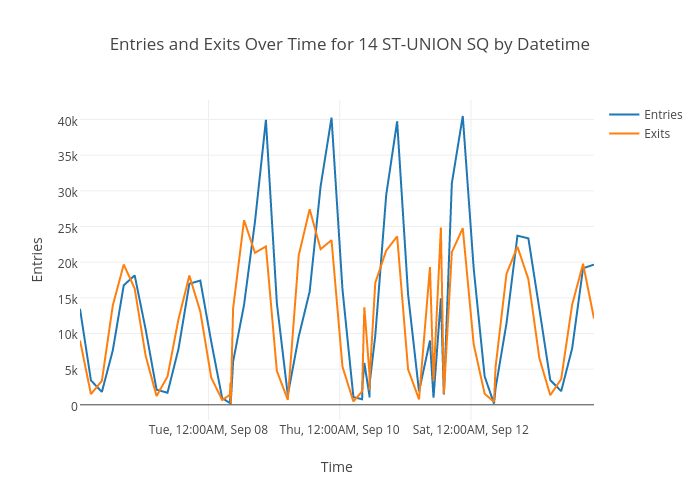
Entries and Exits Over Time for 14 ST-UNION SQ by Datetime
Time
Entries
plotly-logomark
Edit chart
Sherminn's interactive graph and data of "Entries and Exits Over Time for 14 ST-UNION SQ by Datetime" is a scatter chart, showing Entries vs Exits; with Time in the x-axis and Entries in the y-axis.. The x-axis shows values from 0 to 0. The y-axis shows values from 0 to 0.