Linear Smoothing Models
0
2000
4000
6000
0
1
2
3
4
5
8
16
32
Upper Tapera Wind Speed
Elapsed Time (sec)
Wind Speed (m/s)
Fit Param
plotly-logomark
Edit chart
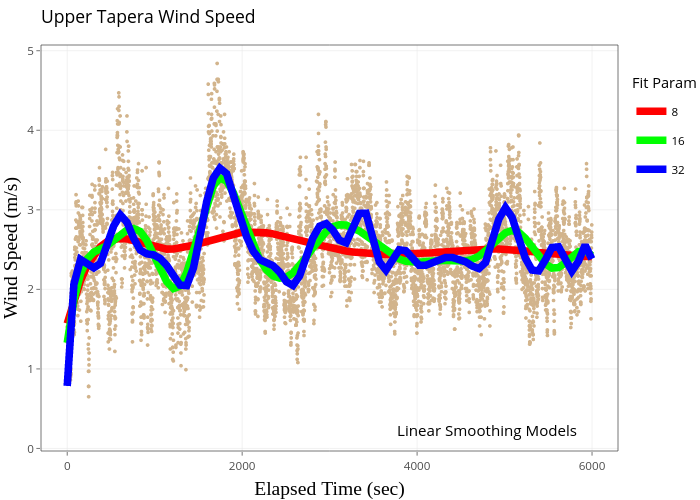
Shellback3's interactive graph and data of "Upper Tapera Wind Speed" is a scatter chart, showing 8, 16, 32; with Elapsed Time (sec) in the x-axis and Wind Speed (m/s) in the y-axis.. The x-axis shows values from -299.85 to 6296.85. The y-axis shows values from -0.032 to 5.072. This visualization has the following annotation: Fit Param