p50
p75
p90
p99
p99.9
0
0.5
1
1.5
2
label
getfd
direct
envoy
haproxy
Query latency by service mesh (at 25 concurrent requests targetting 1000 QPS)
percentile
Latency (ms)
plotly-logomark
Edit chart
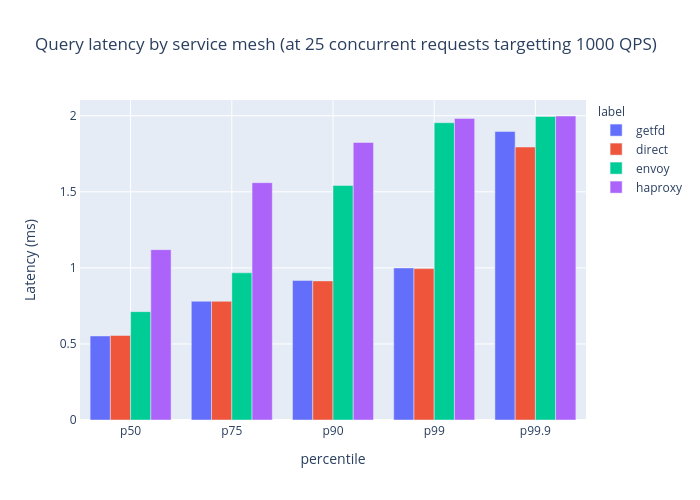
Sargun's interactive graph and data of "Query latency by service mesh (at 25 concurrent requests targetting 1000 QPS)" is a grouped bar chart, showing getfd, direct, envoy, haproxy; with percentile in the x-axis and Latency (ms) in the y-axis.. The x-axis shows values from 0 to 0. The y-axis shows values from 0 to 0.