00:10
Sep 6, 2021
00:12
00:14
00:16
00:18
00:20
00:22
00:24
00:26
00:28
30
40
50
60
70
Referência
Ambiente
Interna
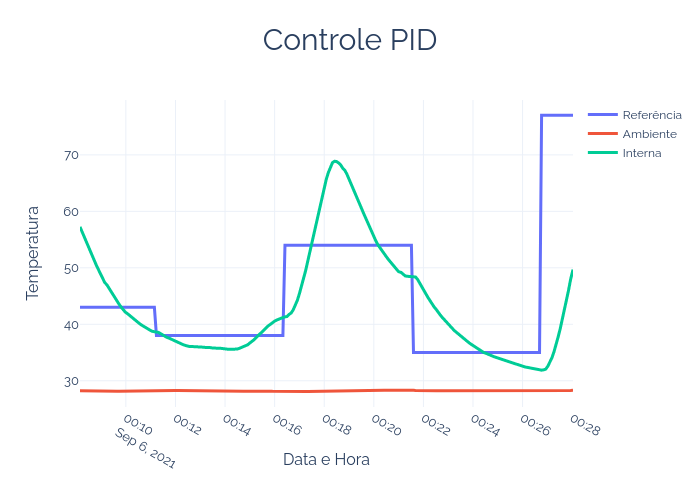
Controle PID
Data e Hora
Temperatura
plotly-logomark
Edit chart
Rogerioo's interactive graph and data of "Controle PID" is a line chart, showing Referência, Ambiente, Interna; with Data e Hora in the x-axis and Temperatura in the y-axis.. The x-axis shows values from 2021-09-06 00:08:09 to 2021-09-06 00:28:02. The y-axis shows values from 25.351666666666667 to 79.71833333333333.