1949
1950
1951
1952
1953
Phillips Curve 1949-53: Good
2
4
6
8
0
5
10
1965
1966
1967
1968
1969
1970
Phillips Curve 1965-70: Weakening
2
4
6
8
0
5
10
1970
1971
1972
1973
1974
1975
Phillips Curve 1970-75: Collapse
2
4
6
8
0
5
10
1949
1950
1951
1952
1953
1954
1955
1956
1957
1958
1959
1960
1961
1962
1963
1964
1965
1966
1967
1968
1969
1970
1971
1972
1973
1974
1975
Phillips Curve 1949-75: Big Mess
2
4
6
8
0
5
10
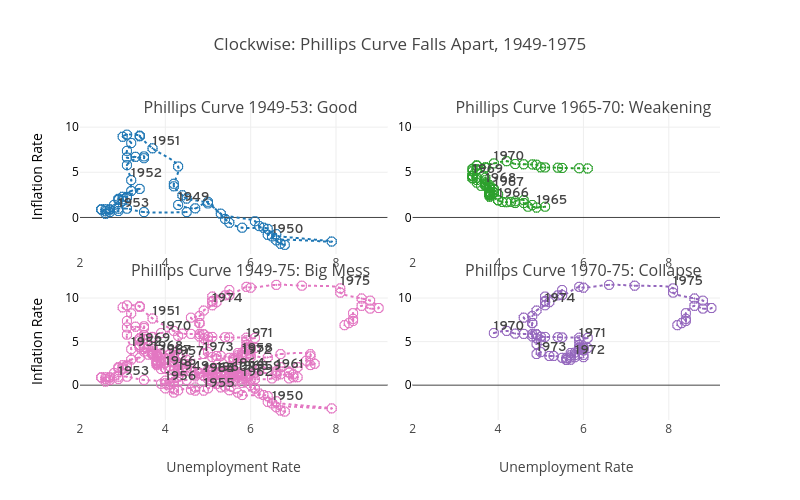
Clockwise: Phillips Curve Falls Apart, 1949-1975
Unemployment Rate
Unemployment Rate
Inflation Rate
Inflation Rate
plotly-logomark
Edit chart
Robertdkirkby's interactive graph and data of "Clockwise: Phillips Curve Falls Apart, 1949-1975" is a line chart; with Inflation Rate in the y-axis. The x-axis shows values from 2.0 to 9.2. The y-axis shows values from -4.0 to 13.0.