0
10
20
30
40
50
60
70
80
90
100
0
500
1000
1500
2000
2500
3000
3500
4000
4500
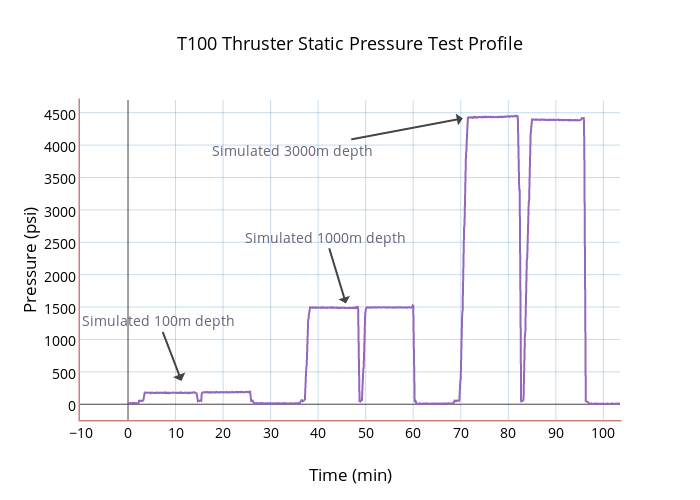
T100 Thruster Static Pressure Test Profile
Time (min)
Pressure (psi)
Simulated 100m depth
Simulated 1000m depth
Simulated 3000m depth
plotly-logomark
Edit chart
Rjehangir's interactive graph and data of "T100 Thruster Static Pressure Test Profile" is a scatter chart, showing Presure (psi); with Time (min) in the x-axis and Pressure (psi) in the y-axis.. The x-axis shows values from 0 to 103.5. The y-axis shows values from -243.31628661111114 to 4695.823225611111. This visualization has the following annotations: Simulated 100m depth; Simulated 1000m depth; Simulated 3000m depth