10k
20k
30k
40k
50k
60k
70k
80k
90k
100k
0
1000
2000
3000
4000
5000
Scheduling Delay
Processing Delay
Throughput
Batch Size
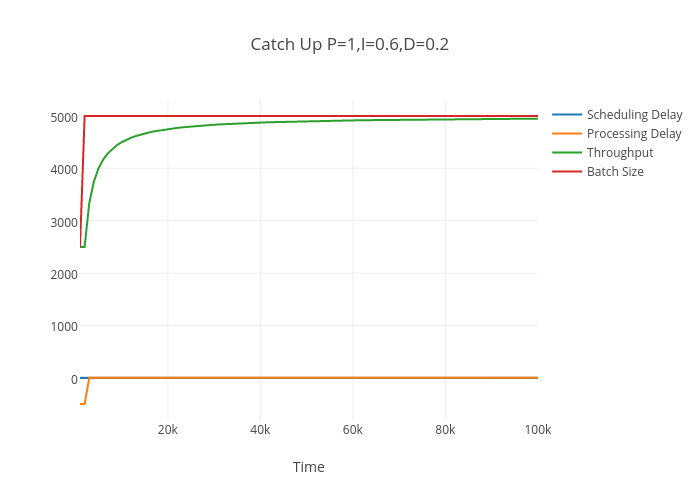
Catch Up P=1,I=0.6,D=0.2
Time
plotly-logomark
Edit chart
Richardstartin's interactive graph and data of "Catch Up P=1,I=0.6,D=0.2" is a line chart, showing Scheduling Delay, Processing Delay, Throughput, Batch Size; with Time in the x-axis. The x-axis shows values from 1000 to 100000. The y-axis shows values from -805.5555555555557 to 5305.555555555556.