0
2
4
6
8
0
0.2
0.4
0.6
0.8
1
1.2
gamma
normal
plotly-logomark
Edit chart
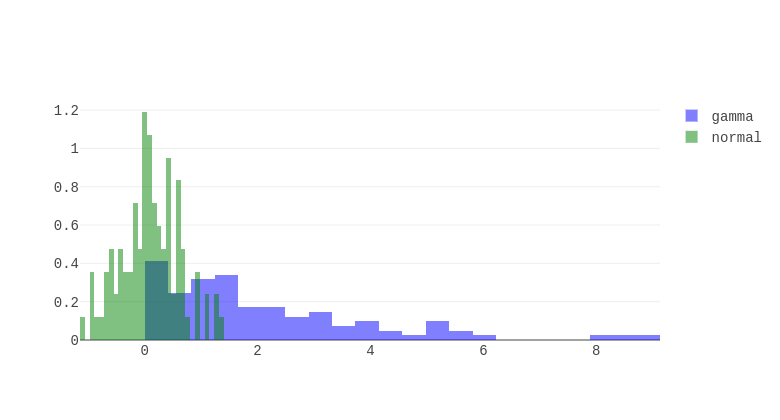
Rep.plotly's interactive graph and data of "gamma vs normal" is a histogram, showing gamma vs normal. The x-axis shows values from 0 to 0. The y-axis shows values from 0 to 0.